- Here is the link to the GitHub repo with codes: [Link].
- Here is the link to the full project report: [Link].
- GRADE A: Clean, up to code, no violations.
- GRADE B: Minor issues to be fixed.
- GRADE C: Major risks, potential closure.
- The restaurants’ data set that we have is a good enough representative sample of the restaurant population in New York City.
- The data is sourced ethically and is collected in a fair manner.
- There is no bias in the data that is collected.
- Grading is not affected by any external factors during the inspection.
- Model Training Focus: Train the model on unique restaurants by eliminating duplicate 'camis' feature inspections.
- Model Expansion: Explore the potential to generalize the model for use in other metropolitan cities beyond New York.
- Model Comparison: Test various models to determine the most suitable for our research problem.
- Deployment Data Utilization: Use deployment data to predict restaurant grades and compare with actual inspection outcomes.
- Feature Engineering: Implement advanced feature engineering, particularly focusing on text-based techniques, to enhance model training and results.
- Model Comparison: Test various models to determine the most suitable for our research problem.
- Anaconda Software Distribution. (2020).Anaconda Documentation. Anaconda Inc. https://docs.anaconda.com/ adresinden erişildi.
- Cortes, C. ve Vapnik, V. (1995). Support-vector networks. Machine learning, 20(3), 273-297.
- Cox, D. R. (1958). The regression analysis of binary sequences. Journal of the Royal Statistical Society: Series B (Methodological), 20(2), 215-232.
- De Jonge, E. (2018). docopt: Command-Line Interface Specification Language. https://CRAN.R-project.org/package=docopt adresinden erişildi.
- Hunter, J. D. (2007). Matplotlib: A 2D graphics environment. Computing in Science & Engineering, 9(3), 90-95. doi:10.1109/MCSE.2007.55.
- Keleshev, V. (2014). docopt: Command-line interface description language. https://github.com/docopt/docopt adresinden erişildi.
- McKinney, W. ve diğerleri. (2011). pandas: a foundational Python library for data analysis and statistics. Python for high performance and scientific computing, 14(9), 1-9.
- Keleshev, V. (2014). docopt: Command-line interface description language. https://github.com/docopt/docopt adresinden erişildi.
- Mock, T. (2022). Tidy Tuesday: A weekly data project aimed at the R ecosystem. https://github.com/rfordatascience/tidytuesday adresinden erişildi.
- Pedregosa, F., Varoquaux, G., Gramfort, A., Michel, V., Thirion, B., Grisel, O., … Duchesnay, E. (2011). Scikit-learn: Machine Learning in Python. Journal of Machine Learning Research, 12, 2825-2830.
- Pérez, F. ve Granger, B. E. (2007). IPython: a System for Interactive Scientific Computing. Computing in Science and Engineering, 9(3), 21-29. doi:10.1109/MCSE.2007.53.
- Van Rossum, G. ve Drake, F. L. (2009). Python 3 Reference Manual. Scotts Valley, CA: CreateSpace.
- VanderPlas, J., Granger, B., Heer, J., Moritz, D., Wongsuphasawat, K., Satyanarayan, A., … Sievert, S. (2018). Altair: Interactive Statistical Visualizations for Python. Journal of Open Source Software, 3(32), 1057. doi:10.21105/joss.01057.
- Xie, Y. (2014). knitr: A Comprehensive Tool for Reproducible Research in R. V. Stodden, F. Leisch ve R. D. Peng (Ed.), Implementing Reproducible Computational Research içinde. Chapman; Hall/CRC. http://www.crcpress.com/product/isbn/9781466561595 adresinden erişildi.
Executive Summary
In this project, we developed a classification model using logistic regression and support vector machines (SVMs), leveraging health inspection data to predict the cleanliness grades of restaurants, specifically A (clean and compliant) and F (non-compliant or at risk of closure).
Our best model, a balanced logistic regressor, utilized a C value of 0.024947, 1 numeric feature, 130 text features, and 47 categorical features. Tested on 10,000 samples, it achieved a precision, and recall of 0.999 and an F1 test score of 0.975, indicating high effectiveness in classifying both A and F grade restaurants. The area under the receiver operating characteristic curve was a perfect 1.00, underscoring nearly 100% accuracy in our predictions. Additionally, we streamlined our workflow by developing automated pipelines using Docker and Python Makefile, complete with a dependency diagram.
We used the DOHMH New York City Restaurant Inspection Results dataset from NYC OpenData Portal, sourced from the tidytuesday repository by Thomas Mock. Covering inspections from 2012 to 2018, the dataset includes detailed information on each restaurant's inspection, including business details and inspection results. Restaurants were graded A, B, C, or assigned Z or P for pending reviews.
Introduction
With the restoration of indoor dining post-COVID-19 in New York City, the safety and health standards of restaurants have become crucial. Given the stricter health regulations, there's a likelihood of changes in the grading criteria used by health inspectors:
As data scientists, we focuse on evaluating and predicting the quality of restaurants in NYC, classifying them as 'good' (Grade A) or 'poor' (Grade B/C). We aim to analyze and forecast restaurant grades for specific NYC locations, with plans to expand this analysis to other cities. This project could serve as a guide for residents and tourists, ensuring dining safety and quality.
Our primary research question is: Can we predict a restaurant's grade (A or F) based on health violation metrics during routine inspections?
Exploratory Data Analysis
In our exploratory data analysis of the restaurant dataset, we found that out of 300,000 inspections, only 151,451 had relevant grades recorded. A notable class imbalance was observed, with 79.8% of inspections graded as A (87597 inspections for grade A and 18621 inspections for grade F). Consequently, we framed our research as a binary classification problem, aiming to determine if a restaurant should be graded A (Pass) or F (Fail, including B and C grades), based on set standards. We excluded restaurants with 'PENDING' grades, planning to use them in future model deployment for grade prediction.
Our analysis focused on a training dataset, splitting the original data so that 75% was used for training and the remaining 25% for model validation on ungraded restaurants. A key observation was that many restaurants, identified by their 'camis' feature, underwent multiple inspections. There was uncertainty about whether these restaurants shared names or had name changes between 2012 and 2018. This aspect, not accounted for in our model, was noted as a limitation.
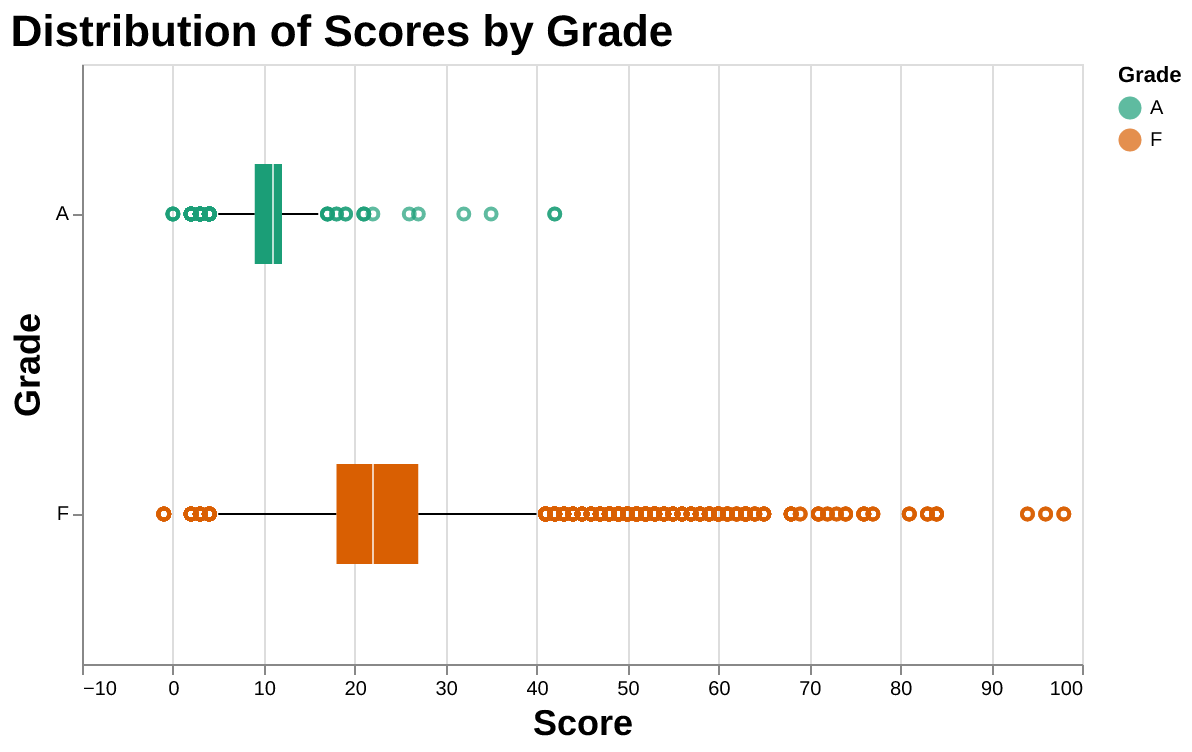
The following plot indicates that restaurants graded F typically have higher average scores compared to those graded A, despite some lower scores among them. This suggests that higher scores are linked to more critical health violations. However, a definitive cut-off for determining an A grade is not evident from this data.
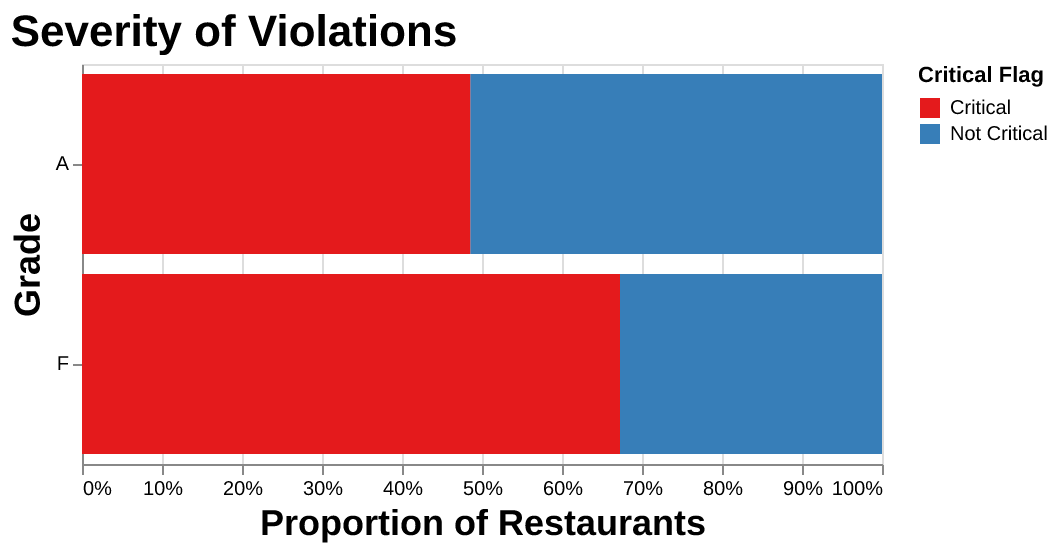
The below plot reveals that Grade F restaurants tend to have more violations than Grade A establishments. Interestingly, even Grade A restaurants have had critical violations. It remains to be seen if our model can discern the impact of violation severity on grading, as the threshold for a 'major' violation is not clearly defined.
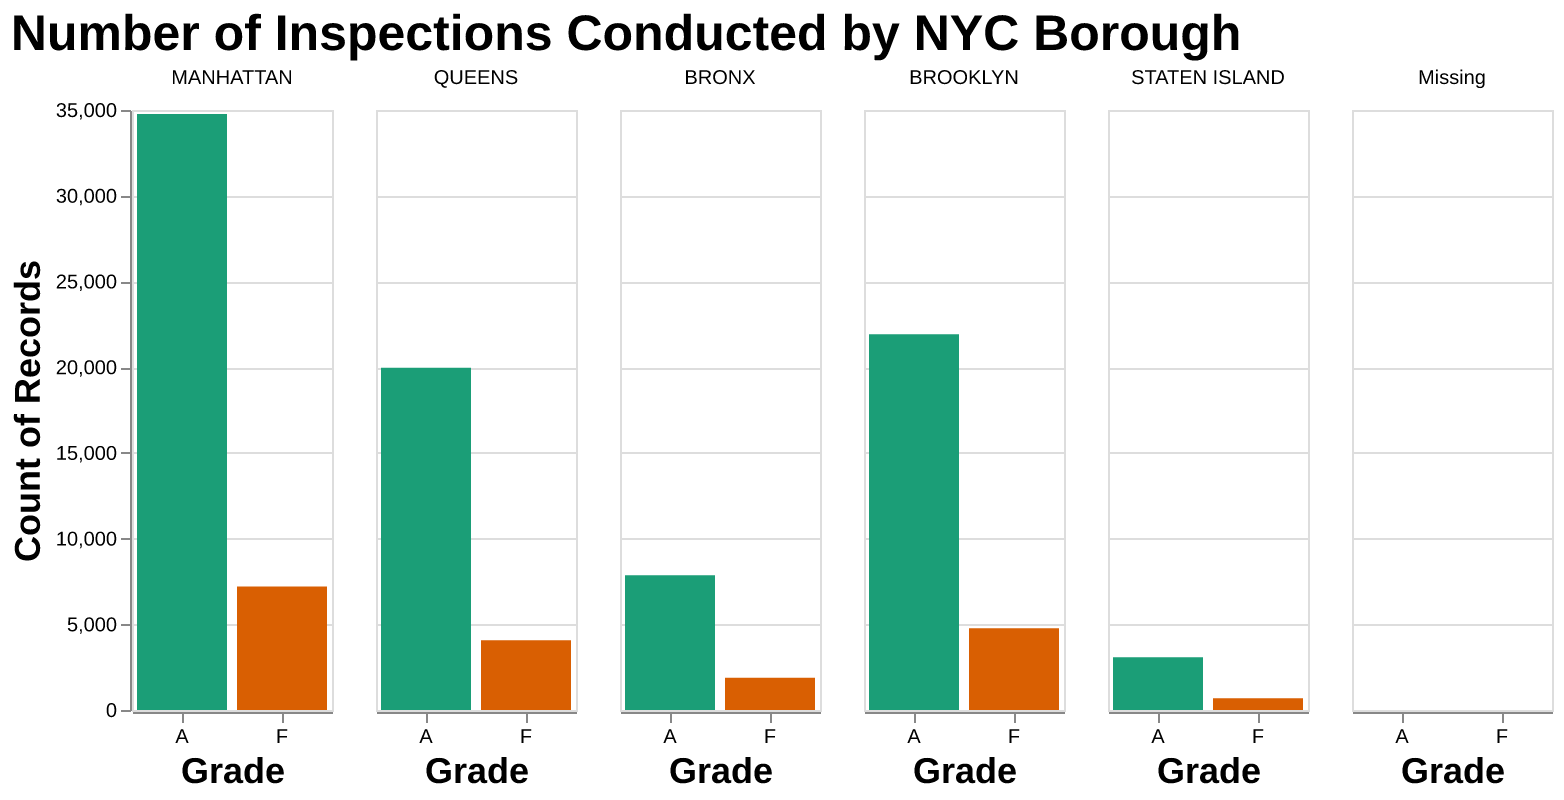
Based on the following plot, we can observe that dining across all neighborhoods in NYC is viable as most restaurants in every borough are graded A. Notably, the bulk of inspections occurred in Manhattan, which also has the highest proportion of Grade F restaurants compared to other boroughs.
Assumptions
In our data analysis, we are making the following assumptions:
Modeling & Results
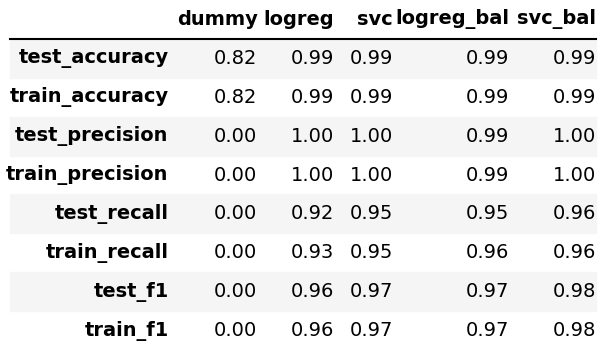
In our binary classification research, we utilized two models - logistic regression (both balanced and imbalanced) and support vector machines (balanced and imbalanced). These were compared against a baseline dummy classifier to gauge performance. To expedite training, we downsized our dataset. As shown in the table, all models outperformed the baseline, with balanced models excelling in cross-validation due to the class imbalance in our dataset. Among these, the balanced logistic regression model demonstrated superior validation scores compared to the support vector model and provided better interpretability for the model, leading us to select it as our primary classifier for training the dataset.
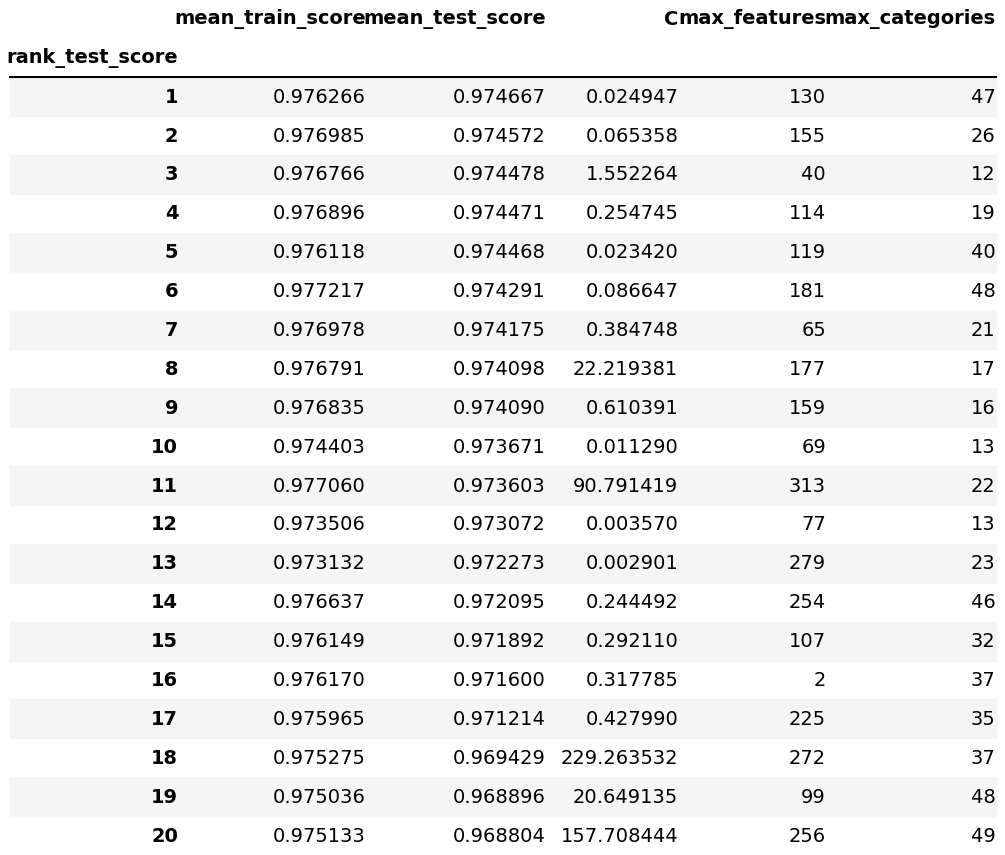
The following figures are the modeling results with Hyperparameter tuning on our selected logistic regression (5-fold)):
The below figure shows the train/validation scores from our best model:
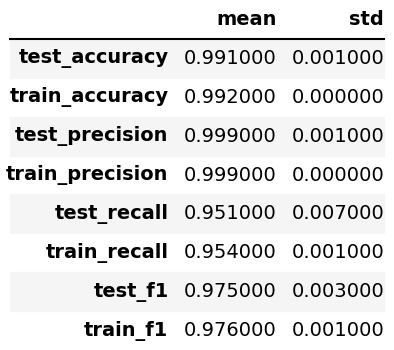
We employed Random Search CV to optimize the hyperparameters of the balanced logistic regression model, resulting in the following settings: C value of 0.024947, max_features at 130, and max_categories at 47. The optimized model yielded impressive results in cross-validation on the training set, achieving an F1 score of 0.975. High precision and recall scores on the validation set indicate the model's accuracy in predicting whether a restaurant will receive an F grade.
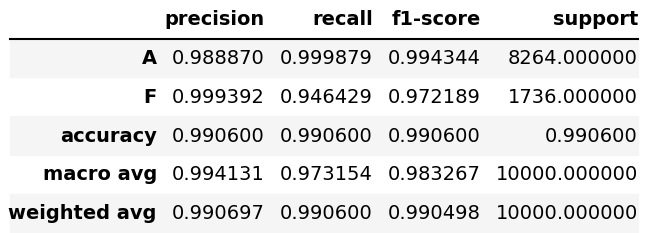
The below plot is the classification report from the best model on the test set:
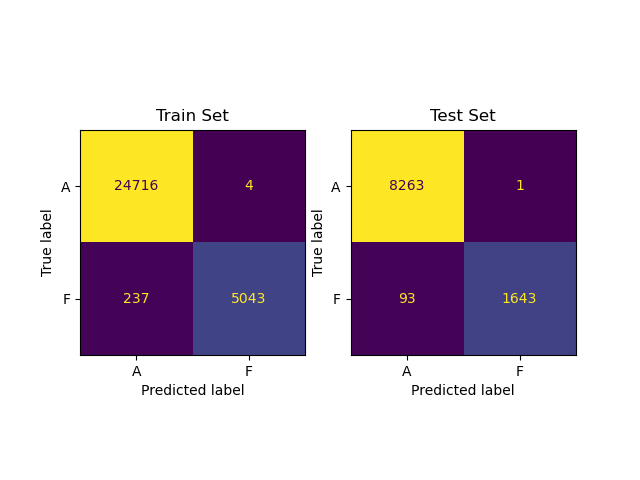
We also plotted the confusion matrices below for the best model on train and test set:
The PR curve below illustrates that our new threshold, set after balancing, achieves an optimal balance of high precision and recall. Lowering this threshold could reduce the recall score, potentially affecting our model's ability to accurately classify restaurants into the GRADE F category:

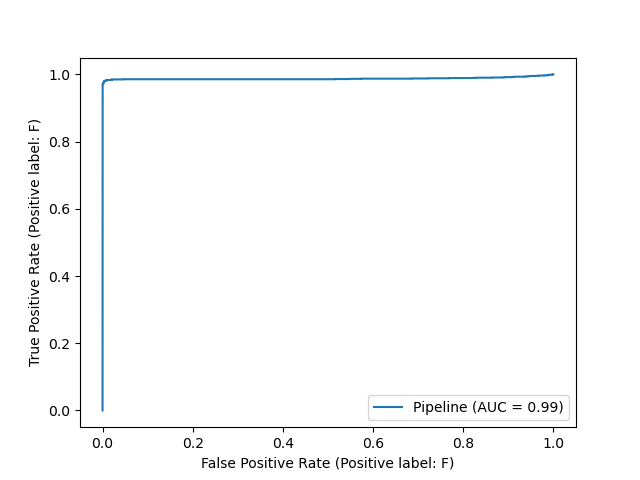
We plotted the following ROC curve using the test set, which illustrates the relationship between the False Positive Rate and the True Positive Rate. The Area Under the Curve (AUC) is 1.00, an optimal value indicating that our model's predictions are 100% accurate.
Note: We acknowledge that our model's F1, precision, and recall scores are exceptionally high on the train, validation, and test sets. This could be attributed to underlying linear relationships between various features and the target.
Limitations
Our exploratory data analysis (EDA) revealed that many restaurants, identified by the 'camis' feature, underwent multiple inspections. However, it's unclear if some restaurants share the same name or changed names between 2012 and 2018. We couldn't filter out restaurants inspected more than once from appearing in both training and validation/test sets. This uncertainty raises concerns about whether our models are learning from the features or specific restaurant instances, potentially affecting prediction accuracy. Additionally, due to limited computational resources, we downsized our training dataset to reduce training time.