- Here is the original visualization code in Pine Script (updated to version 5): [Link].
- Strategy 1 (baseline) : Selecting ten companies with the lowest stock price volatility.
- Strategy 2 : Selecting ten companies with the highest market capitalizations.
- Strategy 3 : Selecting the top company in each of the first ten SIC digits (0-9) based on the highest market capitalization.
- The visualization code for this project was developed using Pine Script, a language specifically designed for stock and financial visualization, compatible exclusively with the TradingView platform. Despite not being written in more common programming languages like Python or Java, Pine Script benefits from the widespread use of TradingView, which boasts over 30 million users. The platform's Pine Script language is well-documented and offers free tutorials, making it accessible for users. Moreover, those who prefer not to use TradingView can easily translate this project's code into other programming languages.
- The focus of this project is primarily on visualization and comparing returns based on historical stock data; it does not provide tools for predicting future returns of stock portfolios. Users interested in forecasting stock prices should refer to other projects that employ more complex modeling techniques.
- Our analysis was limited to U.S. stock data, and the observed superior performance of more diversified portfolios might not necessarily extend to stock markets in other countries. Nonetheless, the benchmarking methods and visualization techniques developed in this project could still be valuable and applicable to stock markets worldwide.
- Bollinger, John. (2002). Bollinger on Bollinger Bands. McGraw Hill.
- Cahen, Philippe. (2001). Dynamic Technical Analysis. Wiley.
- Hyndman, Rob J. (2009). Moving Averages. https://robjhyndman.com/papers/movingaverage.pdf.
- Mannes, John (2016). TradingView, a community for chart-obsessed investors, moves into new markets. TechCrunch.
- Murphy, John J. (1999). Technical Analysis of the Financial Markets (pp. 209–211). New York Institute of Finance.
Executive Summary
Leveraging a combination of non-public financial data and public SEC information, this project provides a comprehensive visual analysis of stock market dynamics from 2008 to 2015, using advanced visualization tools and portfolio strategies. By integrating methods such as Guppy Multiple Moving Average (GMMA), Bollinger Bands, and the Tom DeMark “9” indicator into a user-friendly visualization platform, the project offers valuable insights into stock price movements. This system was particularly beneficial for beginner investors in recognizing signals for buying and selling stocks. Beyond analyzing individual stocks, we formulated and evaluated the performance of three portfolio strategies focusing on low volatility and high market capitalization, underscoring the advantage of diversification across various industries. Our findings over a five-year period demonstrated that a diversified portfolio strategy across various industries yielded better annualized returns than less diversified strategies, providing evidence for the advantages of diversification in stock investment portfolios. This research not only aids in understanding market trends but also guides investors in making informed decisions to optimize their investment returns
Data Introduction
In this project, we utilized non-public time series data from the UCSD Global Financial Database and TradingView, covering daily stock prices, market capitalizations, volatility, and daily returns from 2008 to 2015. Additionally, we incorporated public SEC data about the Standard Industrial Classification (SIC) codes for over 2,000 public companies. The daily stock price data encompassed the highest and lowest daily prices, as well as the opening and closing prices, while daily returns were recorded both in U.S. dollar values and as percentages. The SIC code, a four-digit number, classifies companies into specific business or industry types, with the first digit (ranging from 0 to 9) indicating the major category of the business or industry. These three datasets were then joined and merged based on company ID for further analysis.
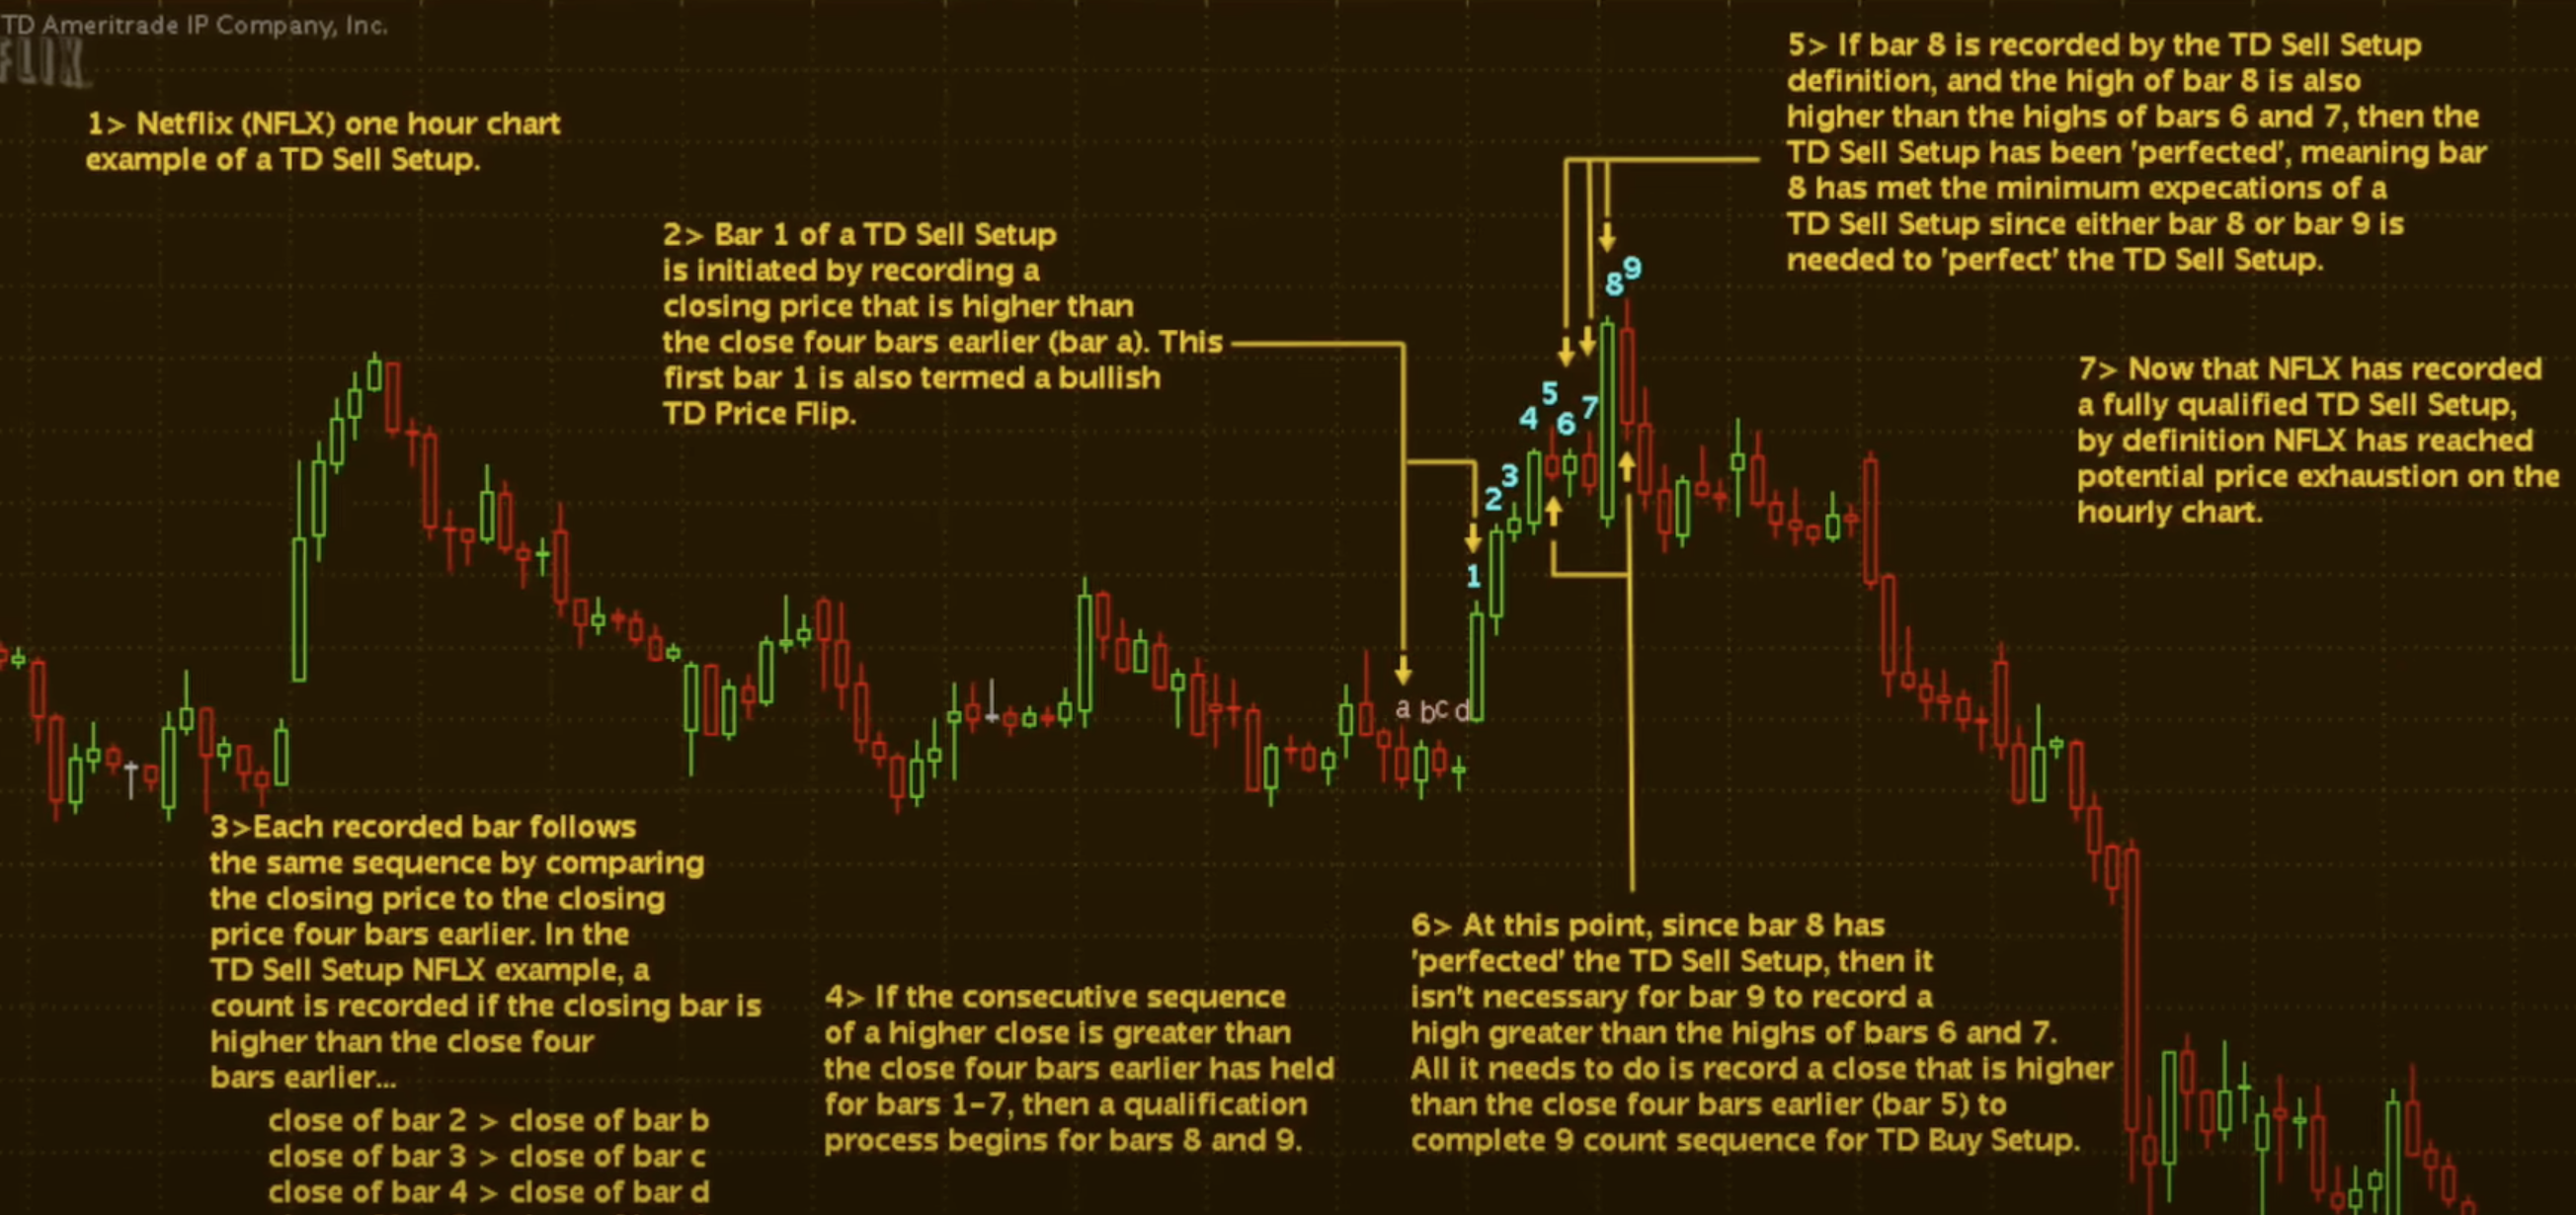
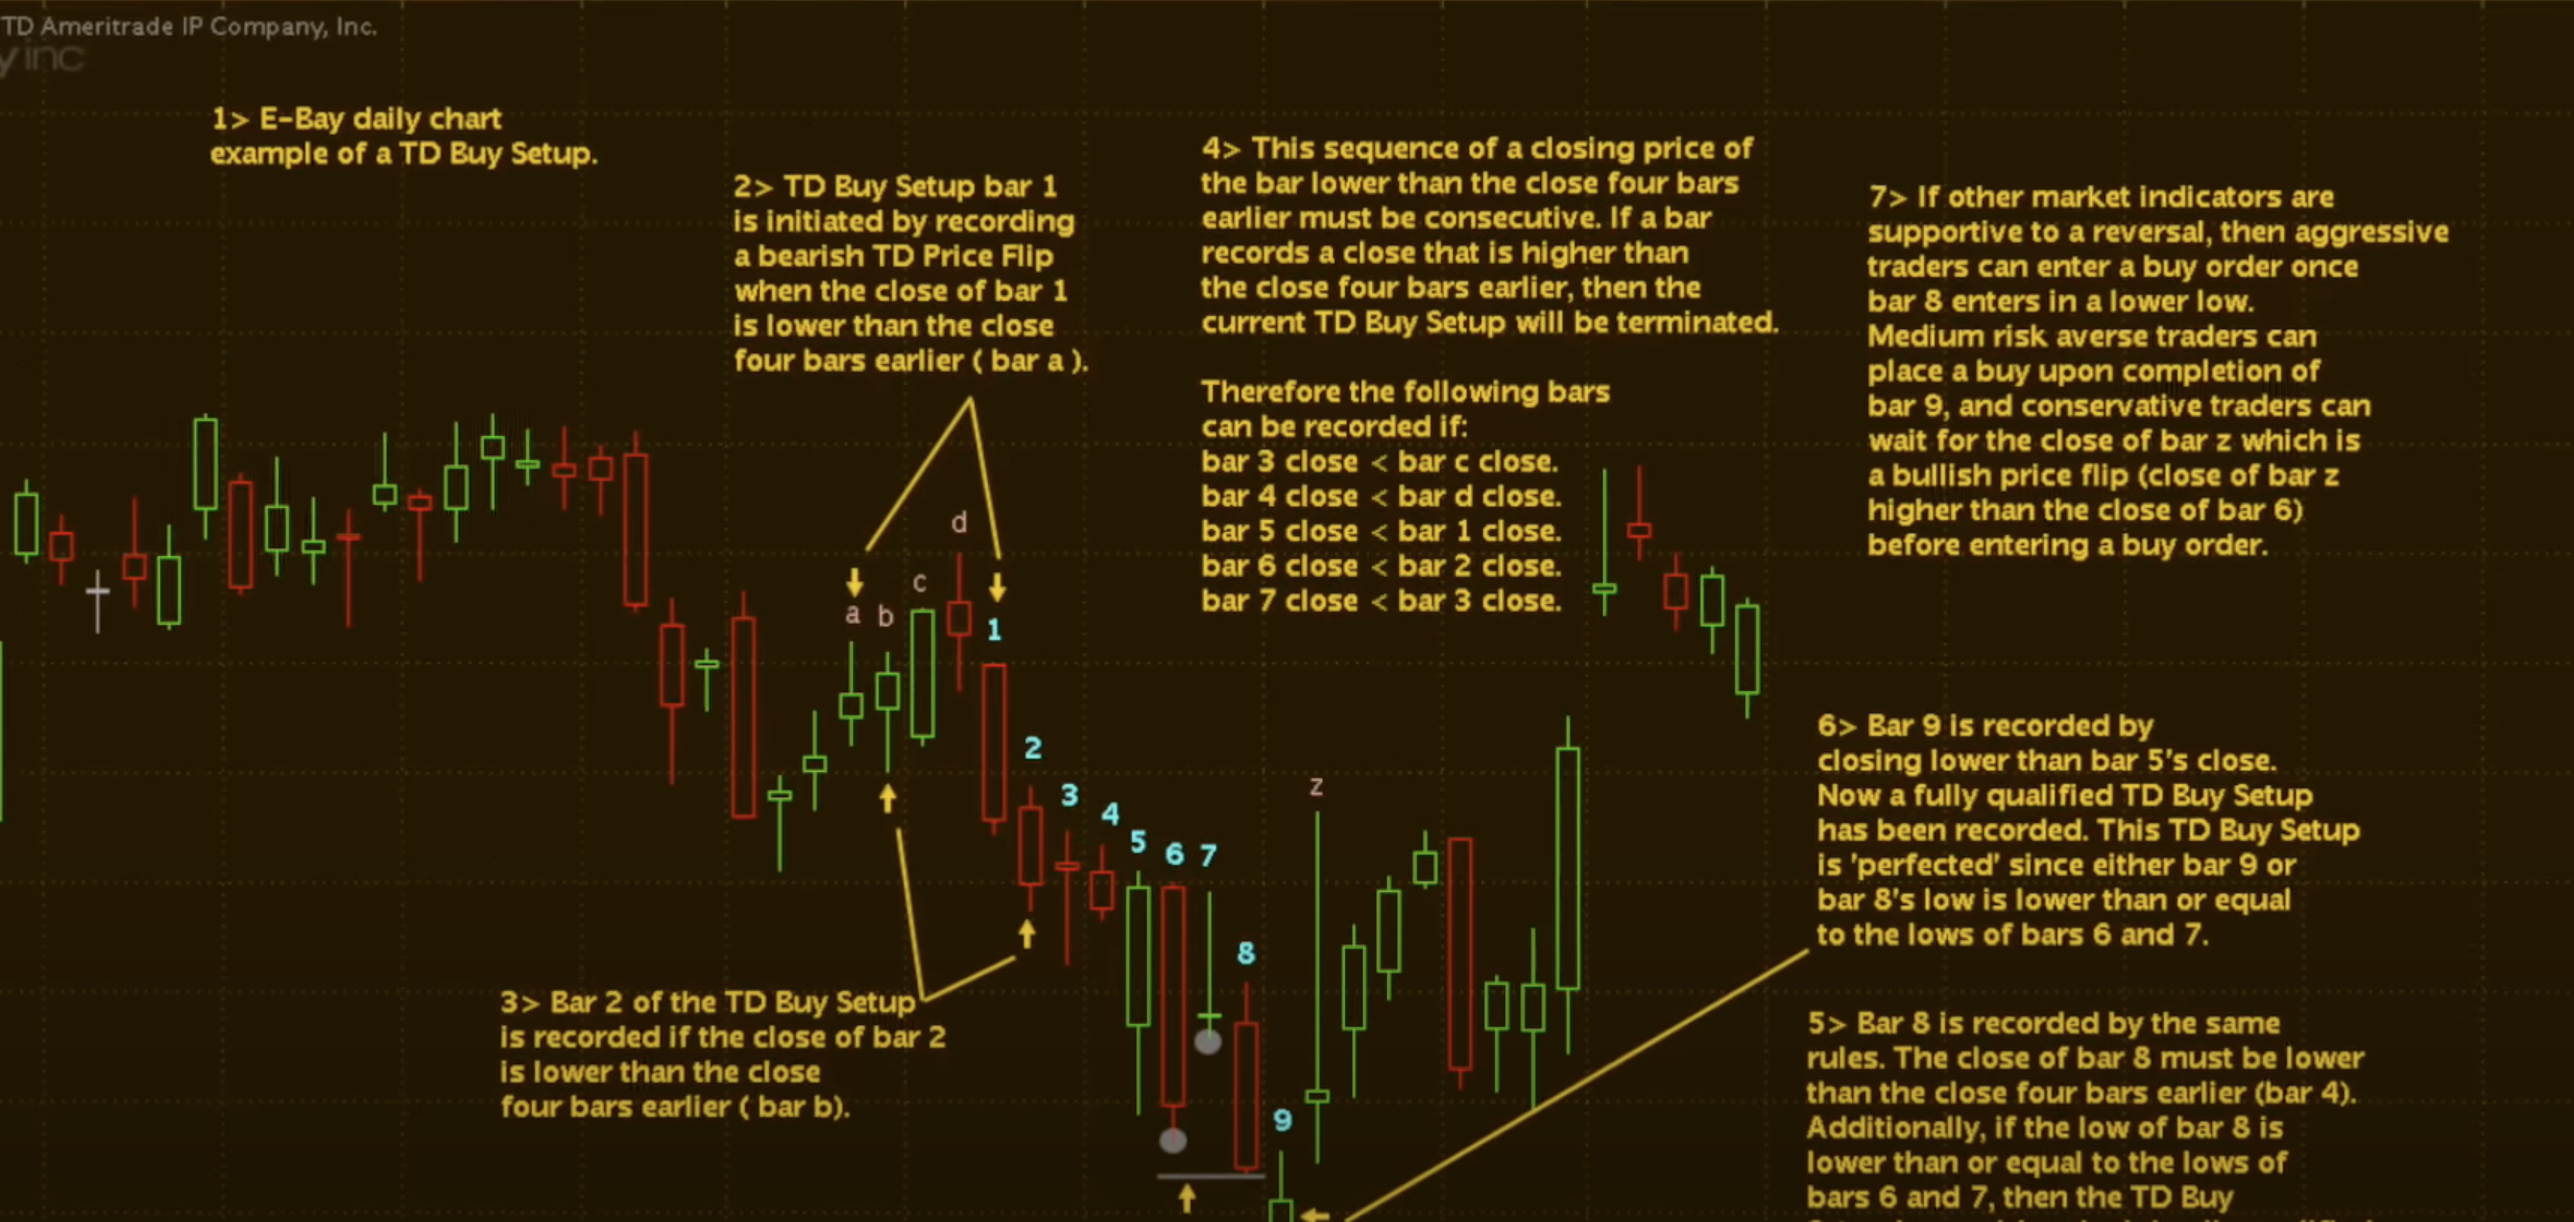
Pine Script Visualization
To enhance the visualization with customizable settings, I developed a system incorporating moving averages (MA), Guppy Multiple Moving Average (GMMA), and Bollinger Bands. Additionally, I integrated the concept of the reversal “9” indicator, conceived by Tom DeMark, the founder of DeMARK Analytics. This approach is particularly user-friendly for beginners in stock investment, as it simplifies the interpretation of market signals. In this system, an upward reversal “9” is indicative of a local high point for stock prices, while a downward reversal “9” suggests a local low point. The figures below provide a more detailed illustration of the reversal “9” concept:
With the assistance of the TradingView platform, I successfully developed an all-in-one visualization using the Pine Script programming language, complete with customized settings. Below are the screenshots showcasing my visualization, which includes Bollinger Bands, GMMA, and the MA systems, specifically applied to Microsoft's stock price:
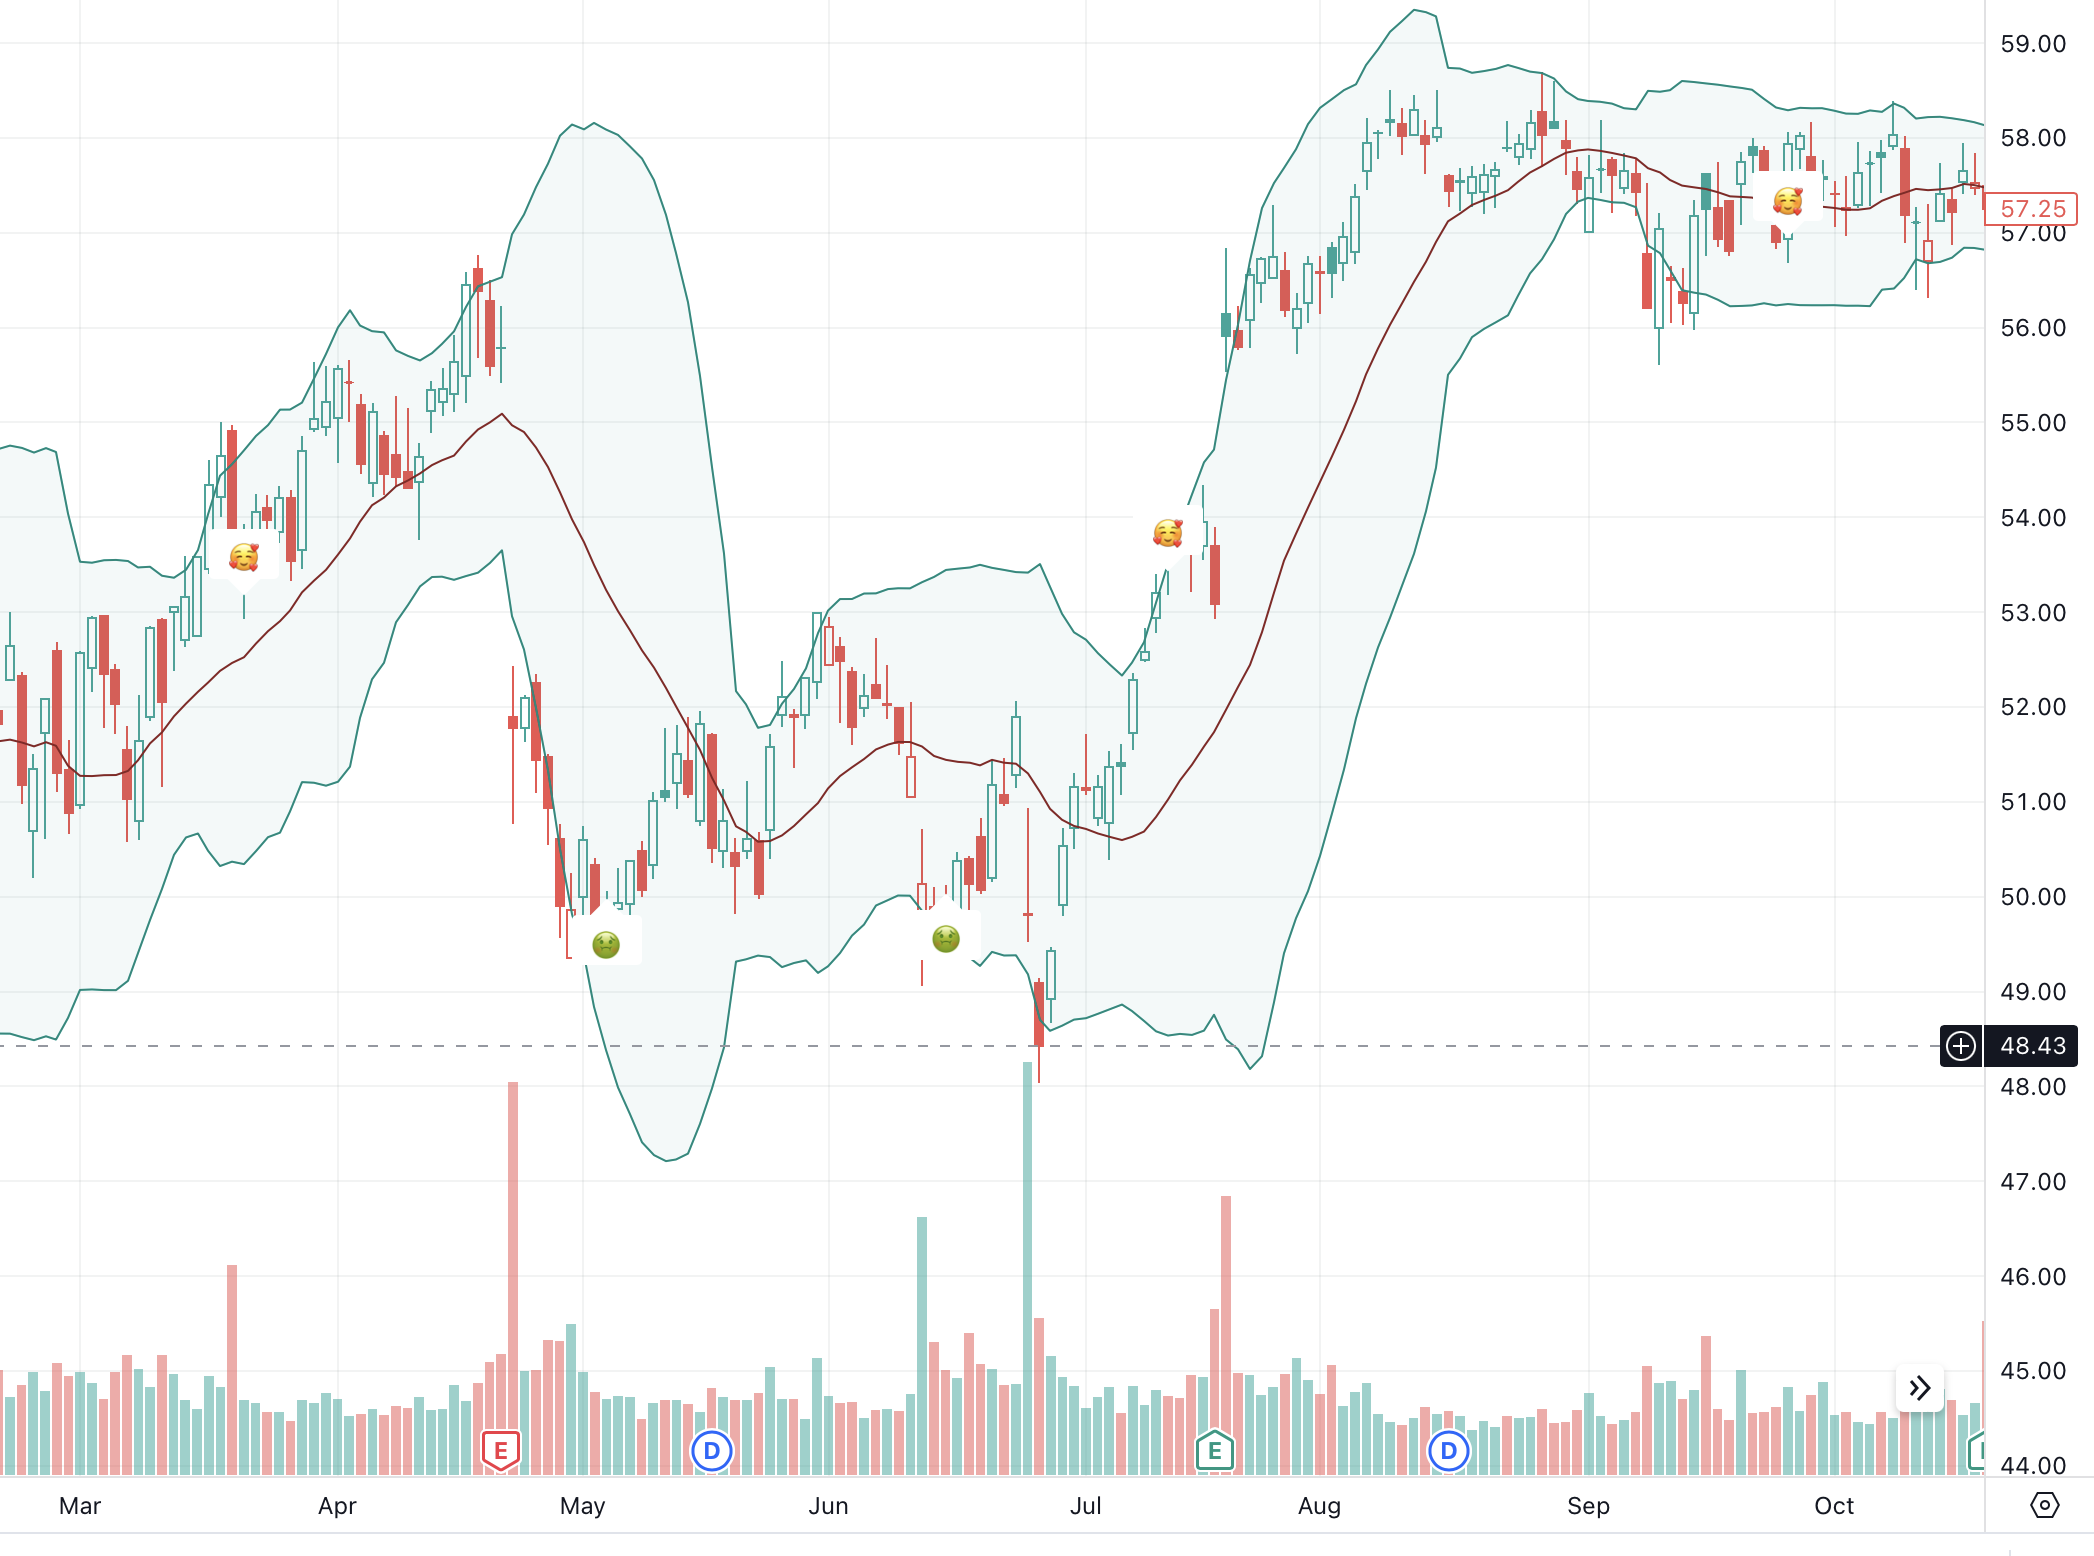
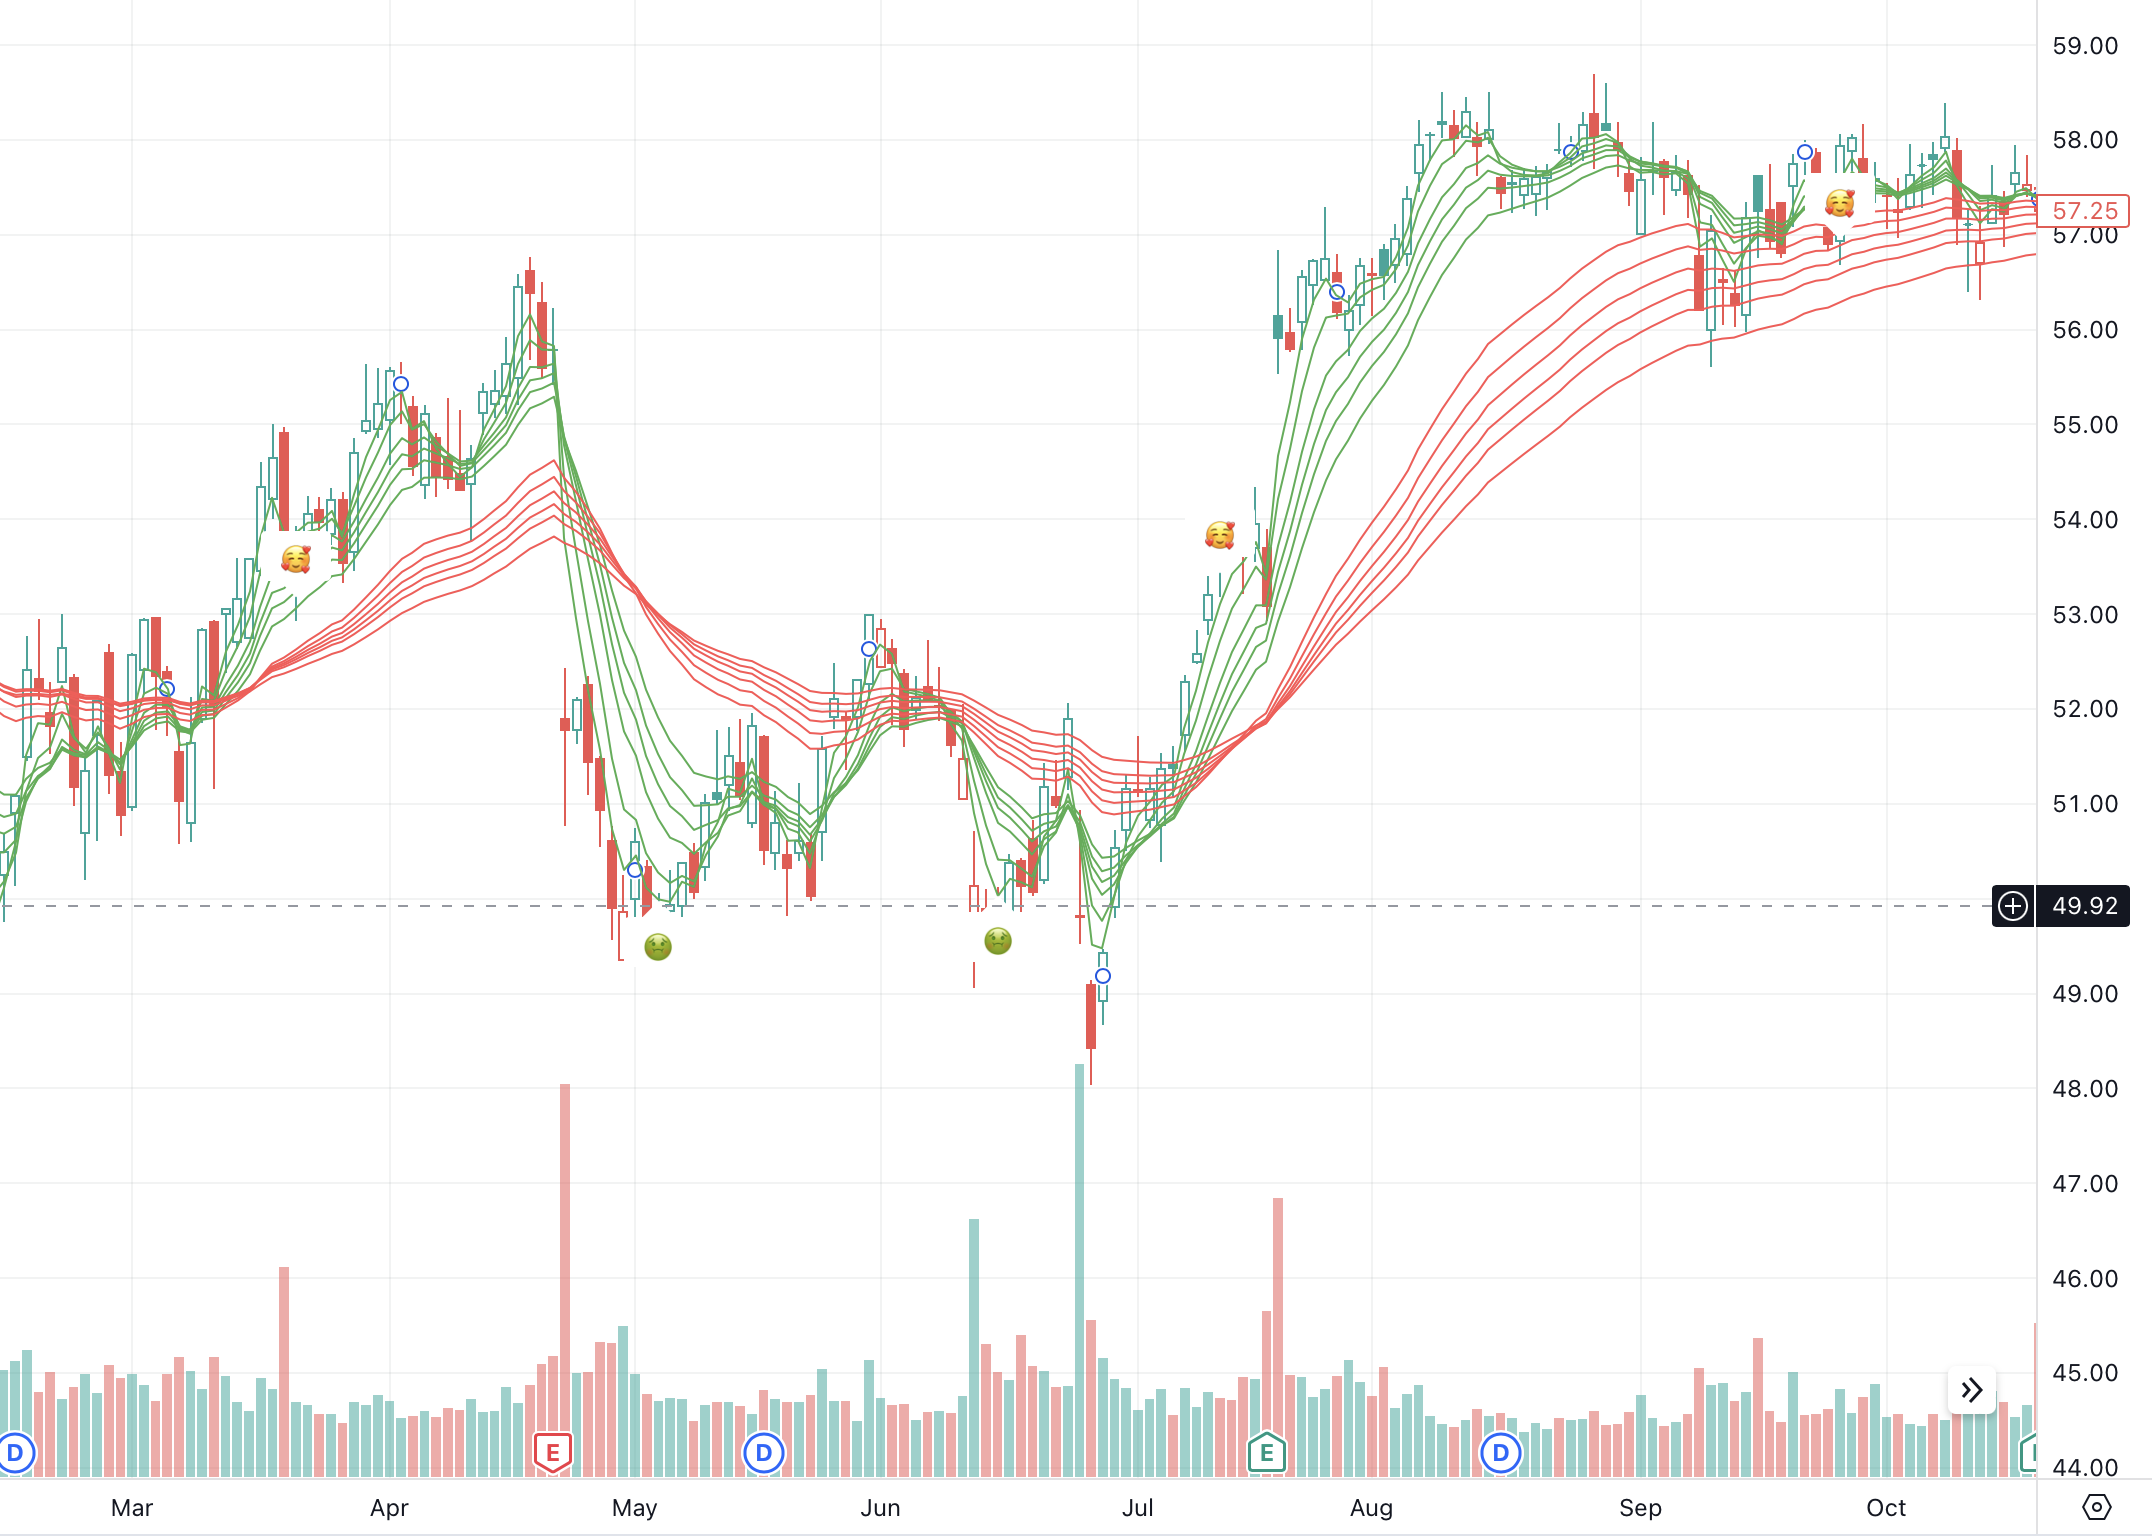
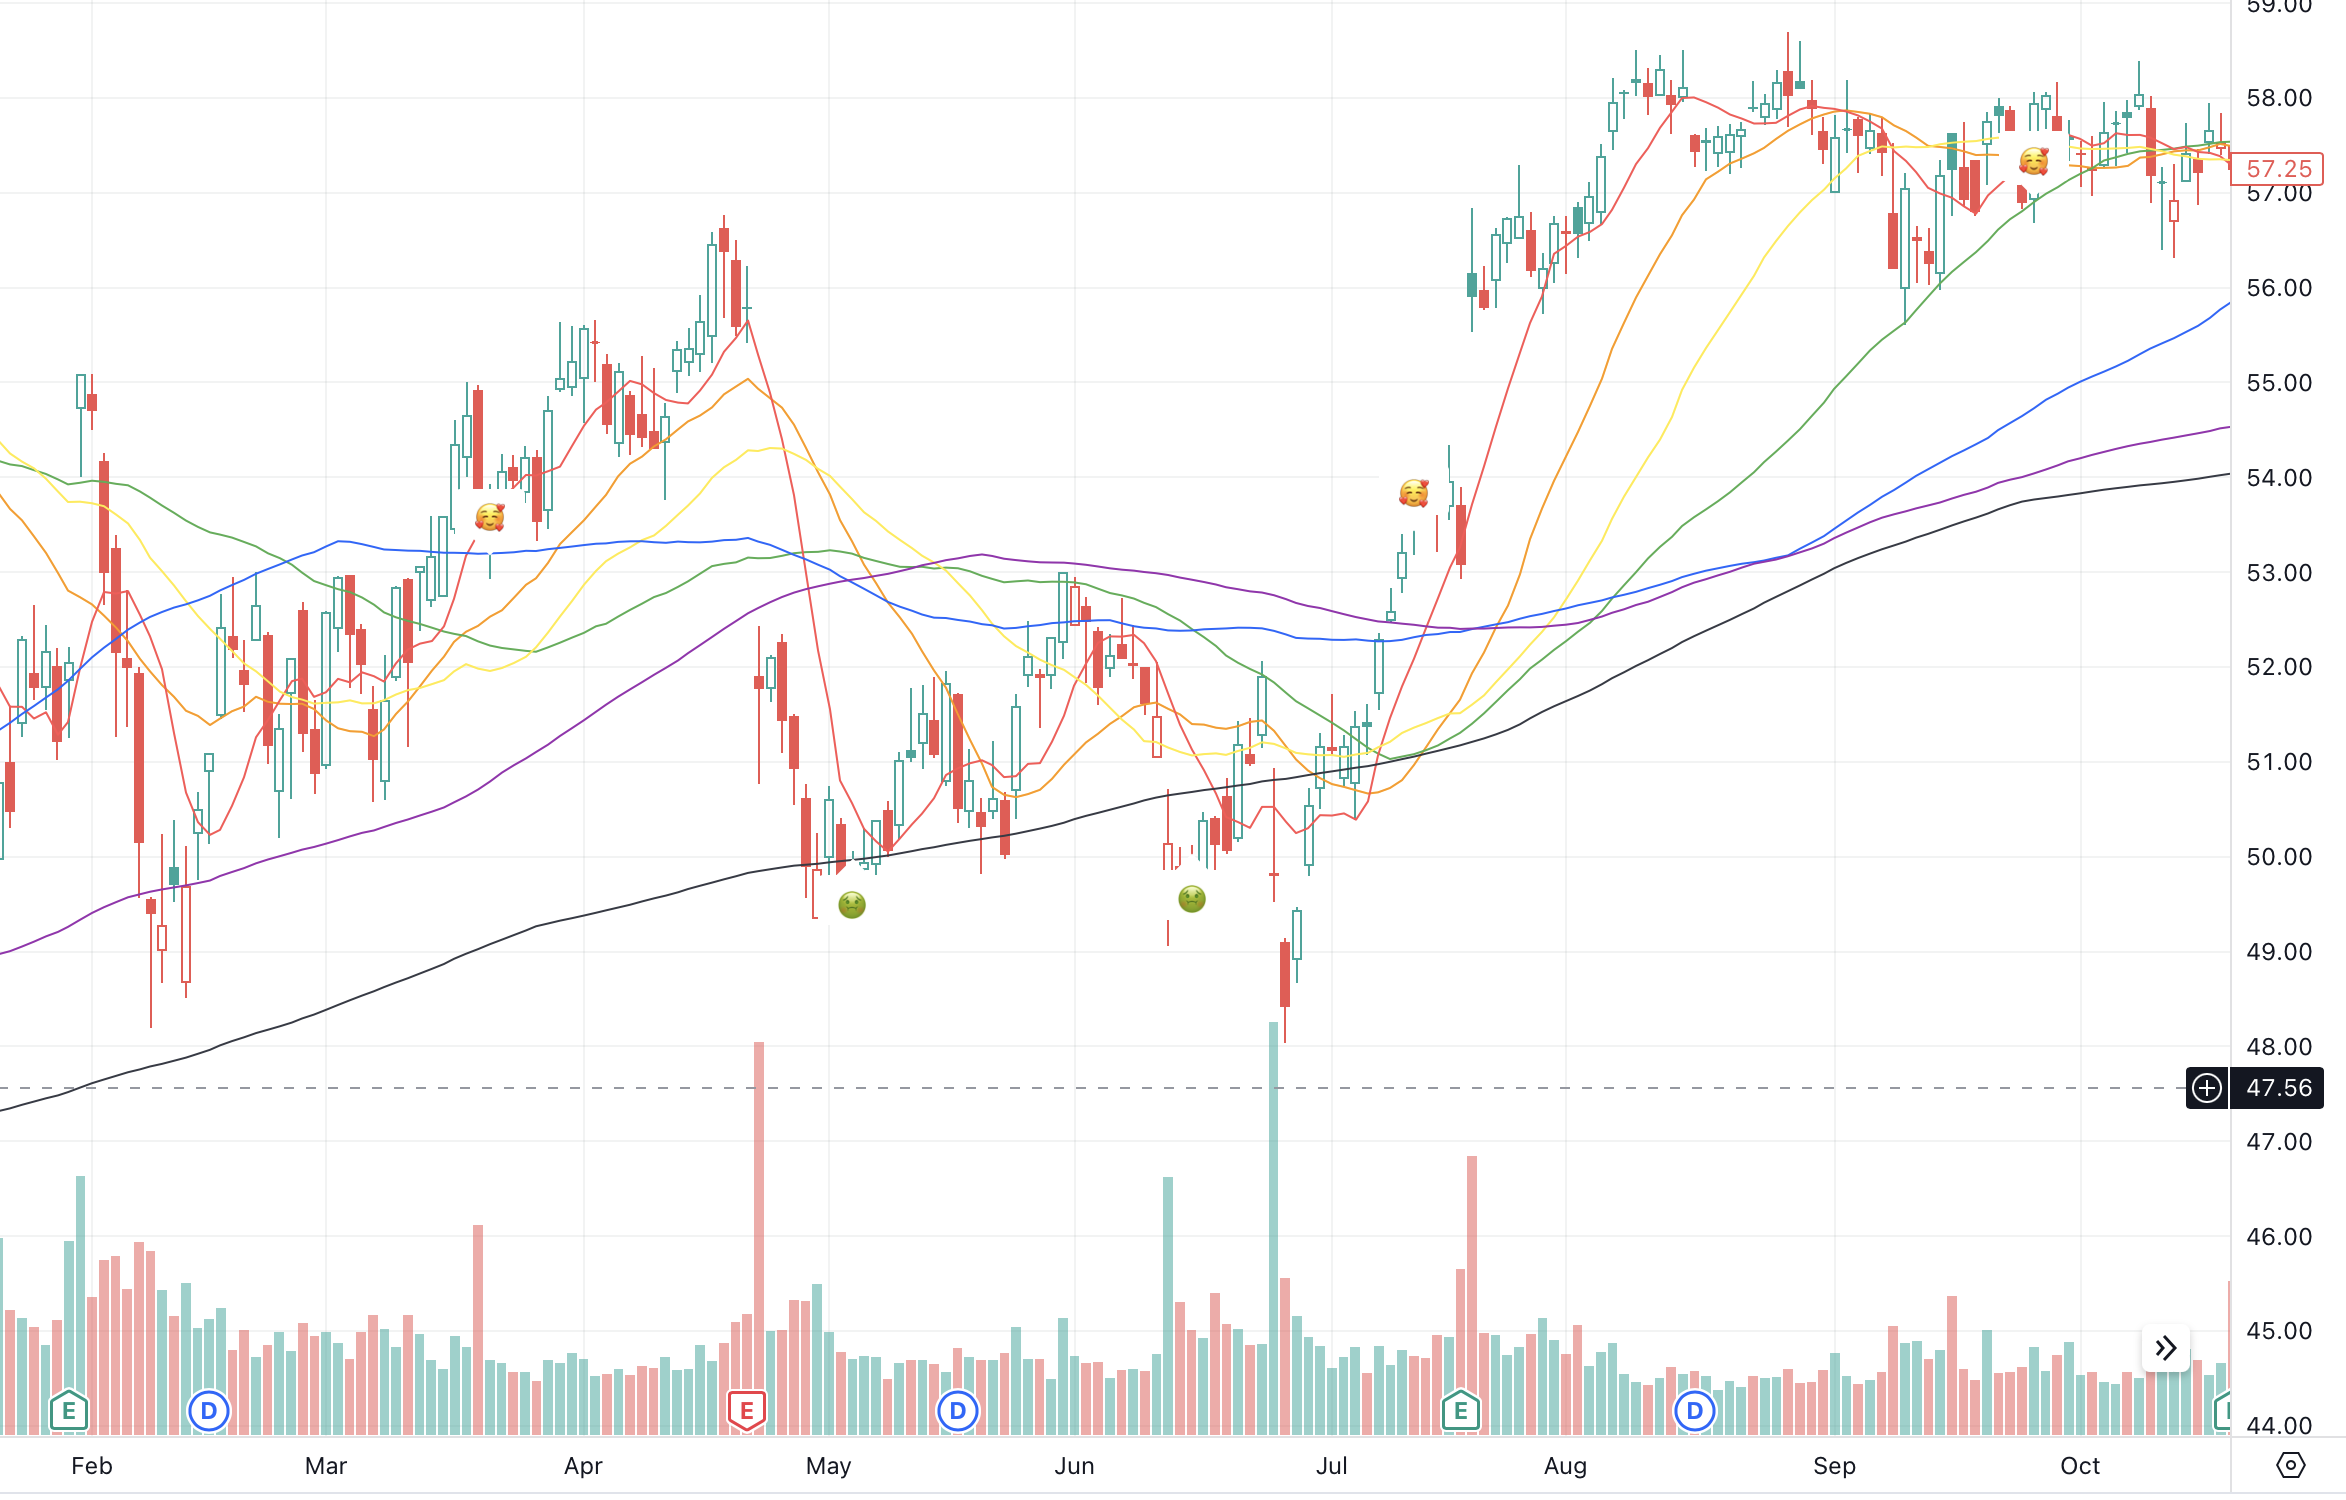
From the aforementioned plots, it's easy to identify the local low points marked with the 🤢 symbol and the local high points indicated by the 🥰 symbol. These benchmarking points can serve as valuable indicators or signals for stock buying and selling actions.
Portfolio Benchmarking
Rather than focusing solely on individual stocks, investors often diversify by selecting a collection of stocks to mitigate potential volatility risks and maximize potential returns. Accordingly, we devised the following three simple portfolio strategies for benchmarking purposes:
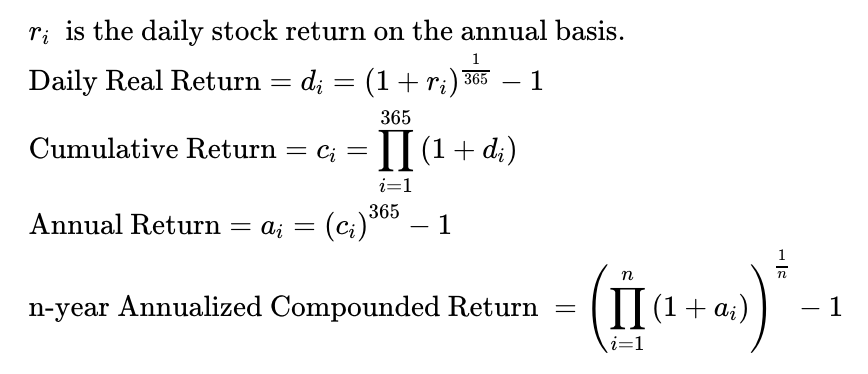
To quantify the performance of our strategies, I calculated the annual return for the three stock portfolios over a period of five years, from 2011 to 2015, using the formula provided below. It's important to note that the total number of trading days in these years was less than 365. For instance, in 2012, there were only 250 trading days.
I then summarized the five-year annualized compounded return for each strategy in the table below:
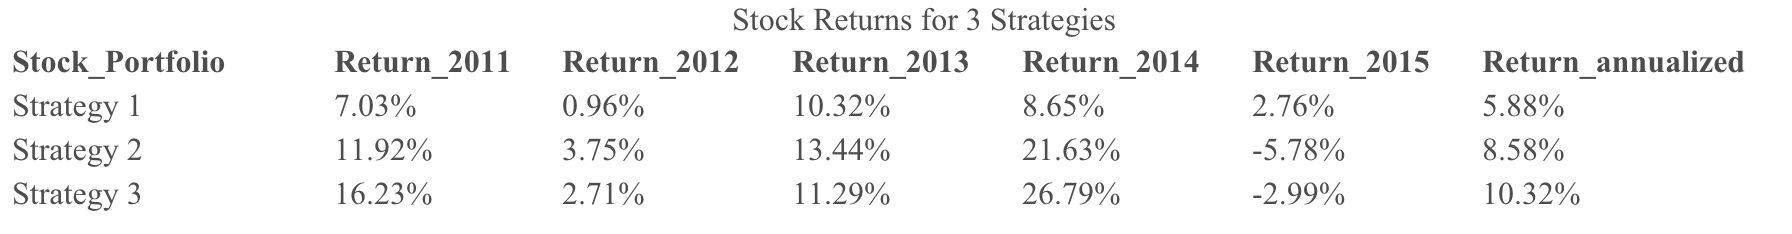
As a more diversified portfolio, the stock collection in Strategy 3 yielded a significantly better annualized return over a five-year horizon compared to the baseline strategy. This outcome provides evidence supporting the advantages of a diverse stock portfolio across various industries.