- Here is the original R code script for this project: [Link].
- The model developed in this project is specifically tailored to UCSD Health Center and its predictions may not be applicable to the broader population of physicians at other health facilities. Caution should be exercised when attempting to generalize these findings to different contexts.
- There is a possibility of omitted variable bias in our model. If there are pertinent factors influencing physician overtime that have not been included, this could result in biased estimates for the variables that are included. Future research should aim to identify and incorporate such variables to enhance the model's accuracy.
- The binary framework of our outcome (overtime vs. no overtime) may oversimplify the complexity of the situation. Incorporating more granular data, such as a continuous measure of overtime hours worked beyond the scheduled shift, could provide deeper insights and a more nuanced understanding.
- While AIC and BIC are valuable for model selection, they do not encompass the model's entire predictive capacity. Future assessments should consider additional metrics, like ROC curves for logistic regression, to more comprehensively evaluate the model's predictive performance.
- Cox, David R. (2006). Principles of statistical inference. Cambridge New York: Cambridge University Press.
- Gelman, Andrew. (2005). Analysis of variance? Why it is more important than ever. The Annals of Statistics.
- Greene, W. H. (1993). Econometric Analysis (2nd ed.). Macmillan.
- Gujarati, Damodar (2009). "Multicollinearity: what happens if the regressors are correlated?". Basic Econometrics (4th ed.). McGraw−Hill.
- Hosmer, David W.; Lemeshow, Stanley. (2000). Applied Logistic Regression (2nd ed.). Wiley.
- Tweney, Dylan. (2009). Unix Lovers to Party Like It's 1234567890. Wired.
- Vrieze, S. I. (2012). Model selection and psychological theory: a discussion of the differences between the Akaike Information Criterion (AIC) and the Bayesian Information Criterion (BIC). Psychological Methods.
- Wooldridge, Jeffrey M. (2009). "Omitted Variable Bias: The Simple Case". Introductory Econometrics: A Modern Approach. Mason, OH: Cengage Learning.
Executive Summary
In this project, we analyzed overtime work patterns among physicians at UC San Diego Health Center, using non-public data from the Health and Psychosocial Instruments (HAPI) database. We investigated factors influencing physician overtime, including patient severity, arrival times, and physician shift schedules. Our analysis revealed that over 40% of patient cases required physicians to work overtime. We examined patient severity levels and arrival patterns, finding that severity did not significantly vary throughout the day, while most patients arrived between 4 am and 5 pm. Using binary logistic regression, we assessed the relationship between actual length of stay (LOS), busy hours, patient age, and physician age with physician overtime. The full model showed that each unit increase in LOS made physicians 1.65 times more likely to work overtime, and, contrary to our expectations, physicians were more likely to work overtime during non-busy hours. This suggests that during busier periods, more physicians might be available, reducing the likelihood of overtime. These insights not only enhance our understanding of physician overtime dynamics at UCSD Health but also pave the way for better workforce management and patient care scheduling in the future.
Data and Preprocessing
Physicians in hospitals typically work in shifts, beginning at a set time and continuing until they have discharged their patients, often extending past their scheduled shift end. This scenario frequently necessitates overtime work for the physicians. In this project, we aim to analyze the factors influencing overtime among physicians at UC San Diego Health Center. The primary data source for our study is the non-public UCSD Health and Psychosocial Instruments (HAPI) database, which includes detailed information about patients and physicians. The dataset comprises patient IDs, arrival and discharge times, ages, expected log lengths of stay (LOS), along with physician IDs, shift schedules, and ages.
In the preprocessing phase of the raw data, our initial step involved devising rules to identify potential data entry errors and missing values. Once these checks were completed, we parsed the physician shift schedule data into two distinct variables: shift start time and shift end time. We then converted all time data to standard Unix time, using POSIXct formats in R. Subsequently, we created a binary 'overtime' column to determine if physicians worked beyond their scheduled shift, based on the comparison of patient discharge times and physician shift end times. Our summary statistics revealed that over 40% of patient cases necessitated overtime work from the attending physicians.
Exploratory Data Analysis
Since the length of stay (LOS) can serve as an indicator of patient severity levels, with longer stays generally suggesting more serious health issues, we have created an hourly patient severity pattern plot. This visual representation below illustrates the mean logarithmic LOS for each hour of the day, providing insights into how patient severity fluctuates over time:
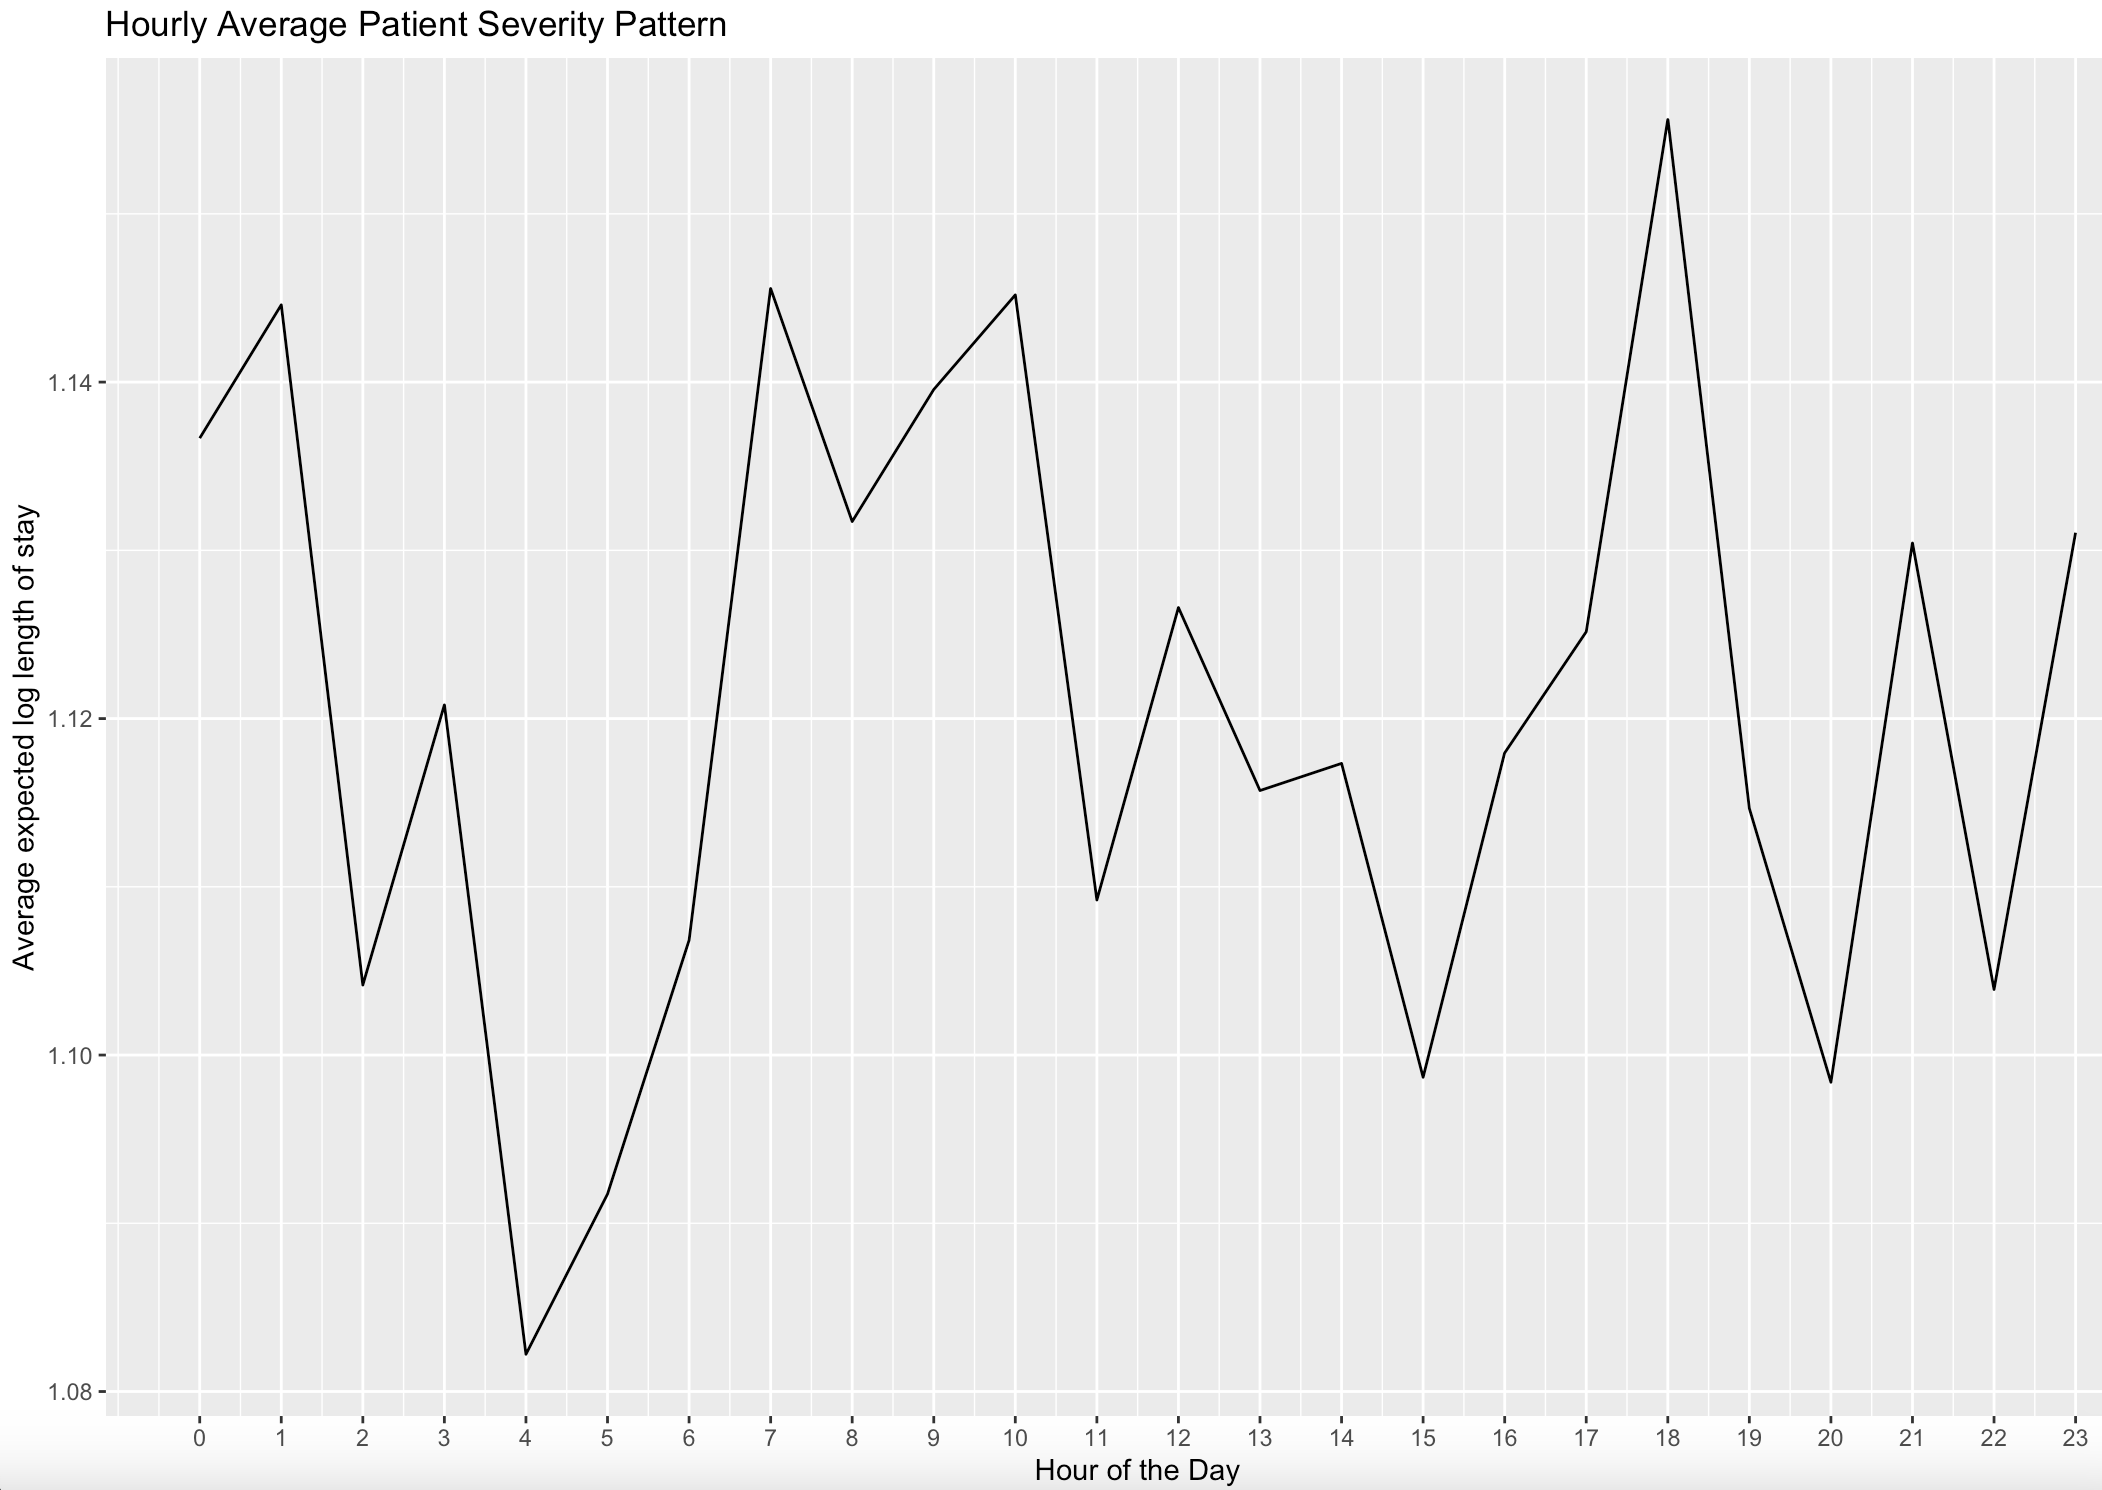
The figure above shows that average patient severity levels varied throughout the day, with noticeable peaks (four spikes) around 1 am, 7 am, 10 am, and 6 pm. These observations from the plot prompt further investigation into whether the hour of the day can predict patient severity. However, when examining the distribution of patient severity by hour below, there is no evident variation in the logarithmic length of stay across different times of the day:
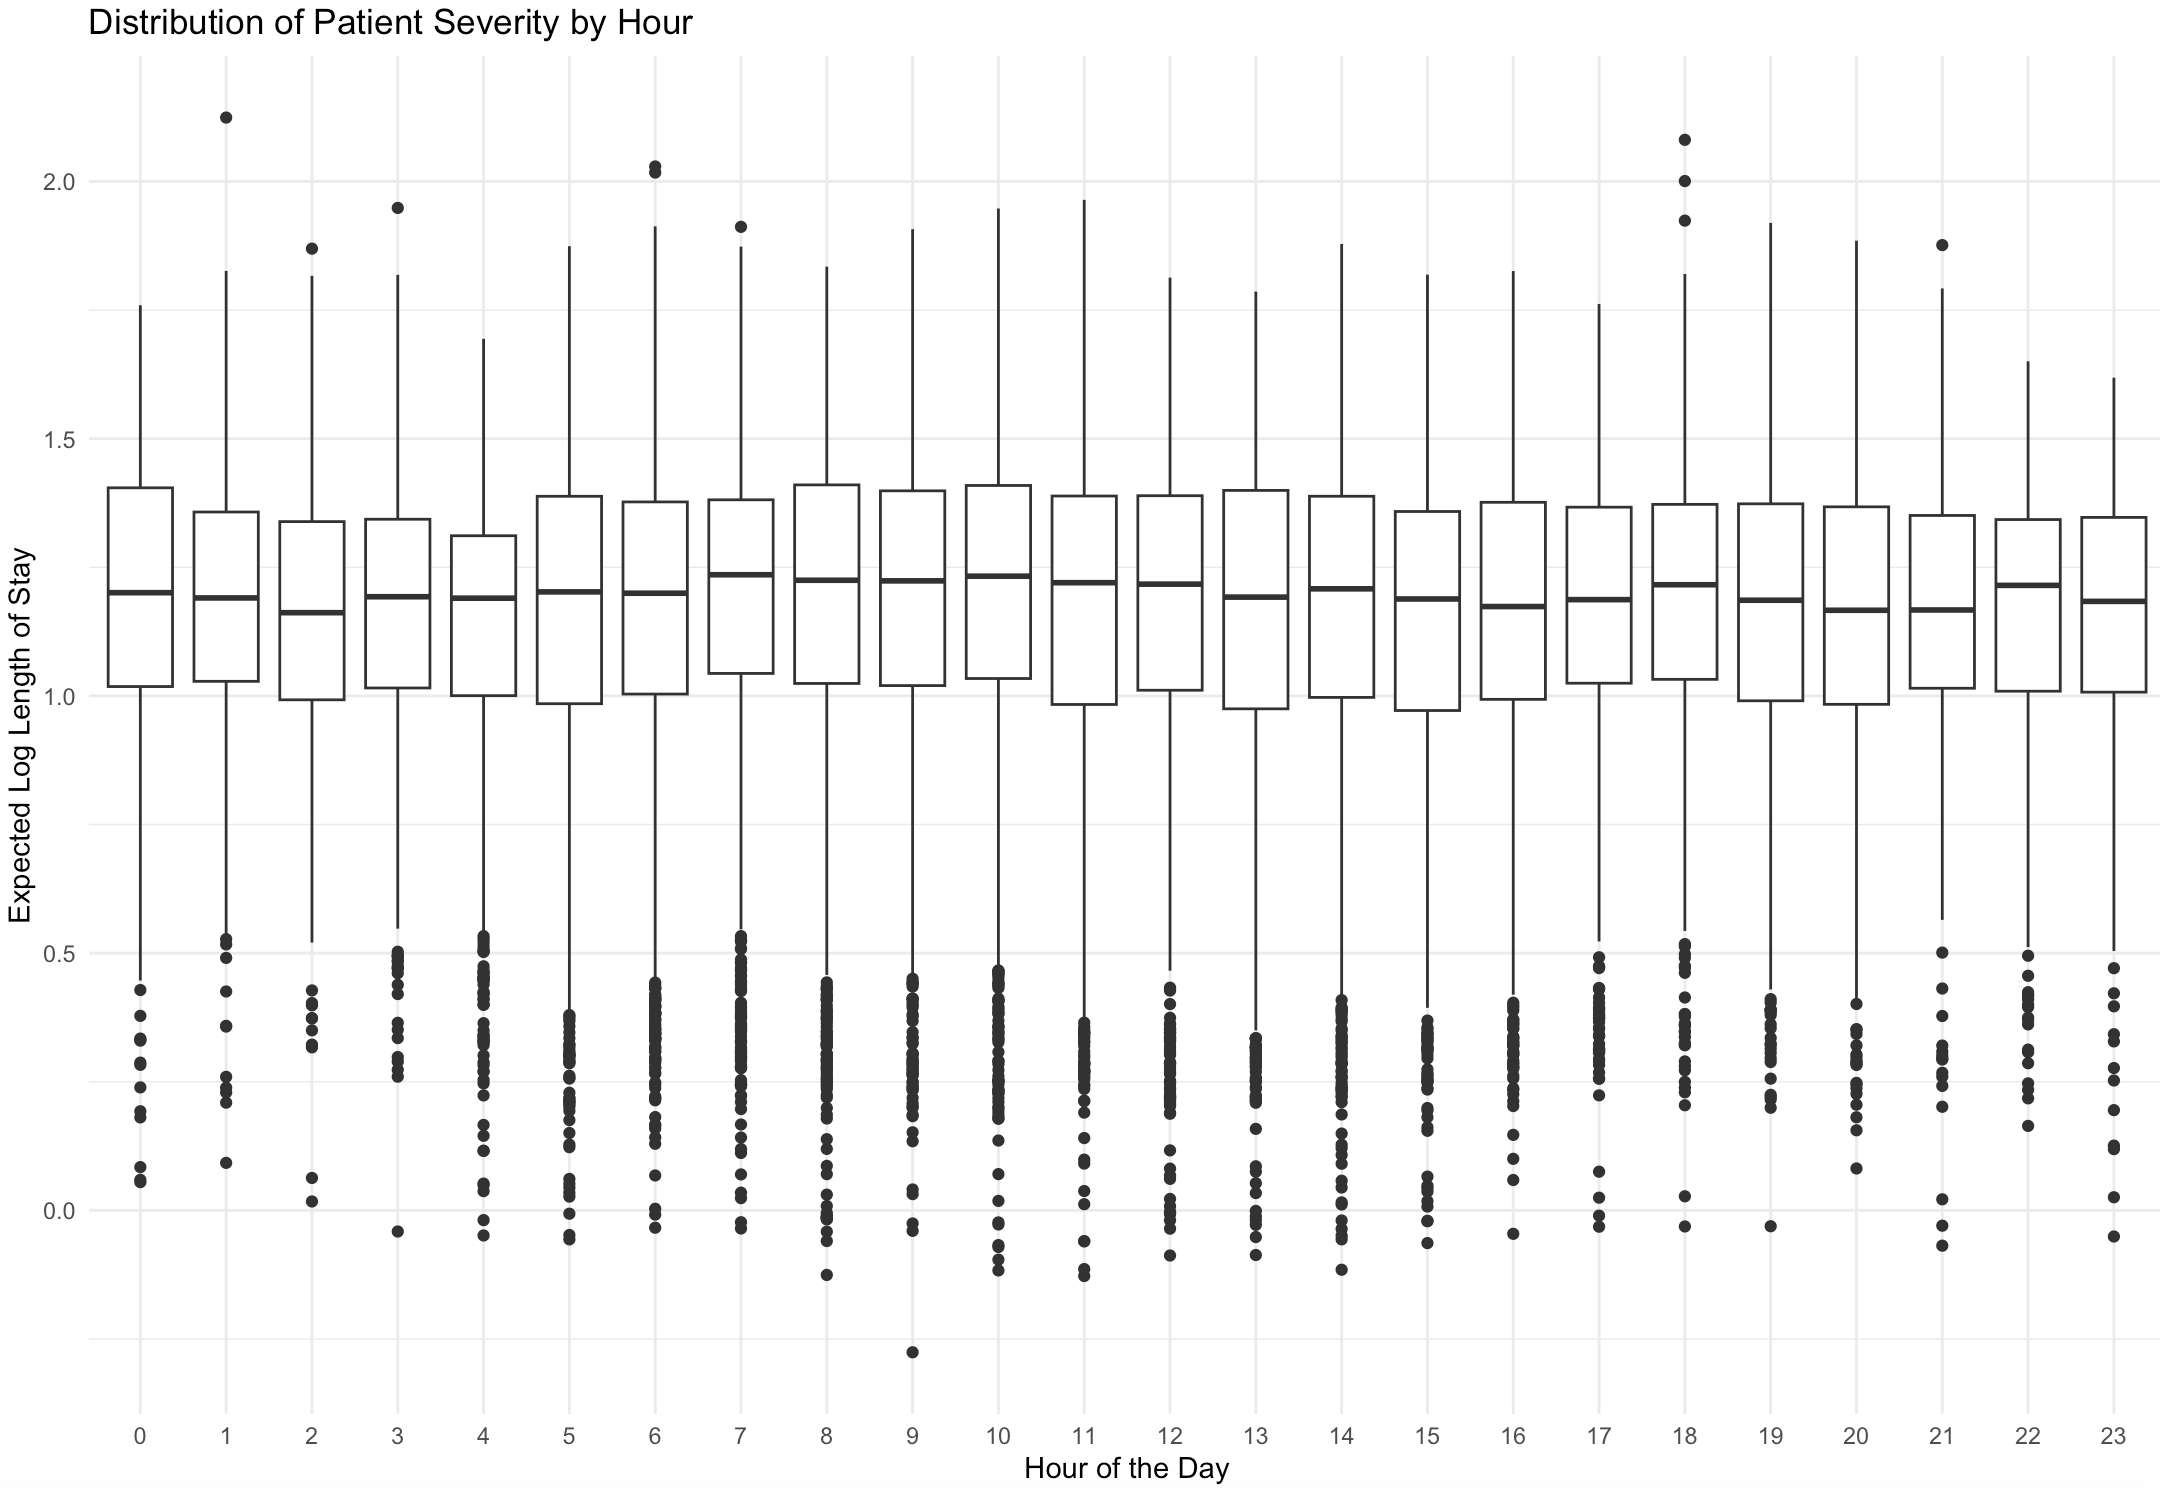
To formally test this hypothesis, we conducted an Analysis of Variance (ANOVA) to determine whether the means of logarithmic length of stay (log LOS) vary significantly across different hours of the day. With a p-value of 0.632 and a significance level set at 0.05, the results suggest that, on average, patient severity does not significantly vary by the hour of the day.
Furthermore, we have illustrated the hourly pattern of patient arrivals through the following plot, which is based on patient count:
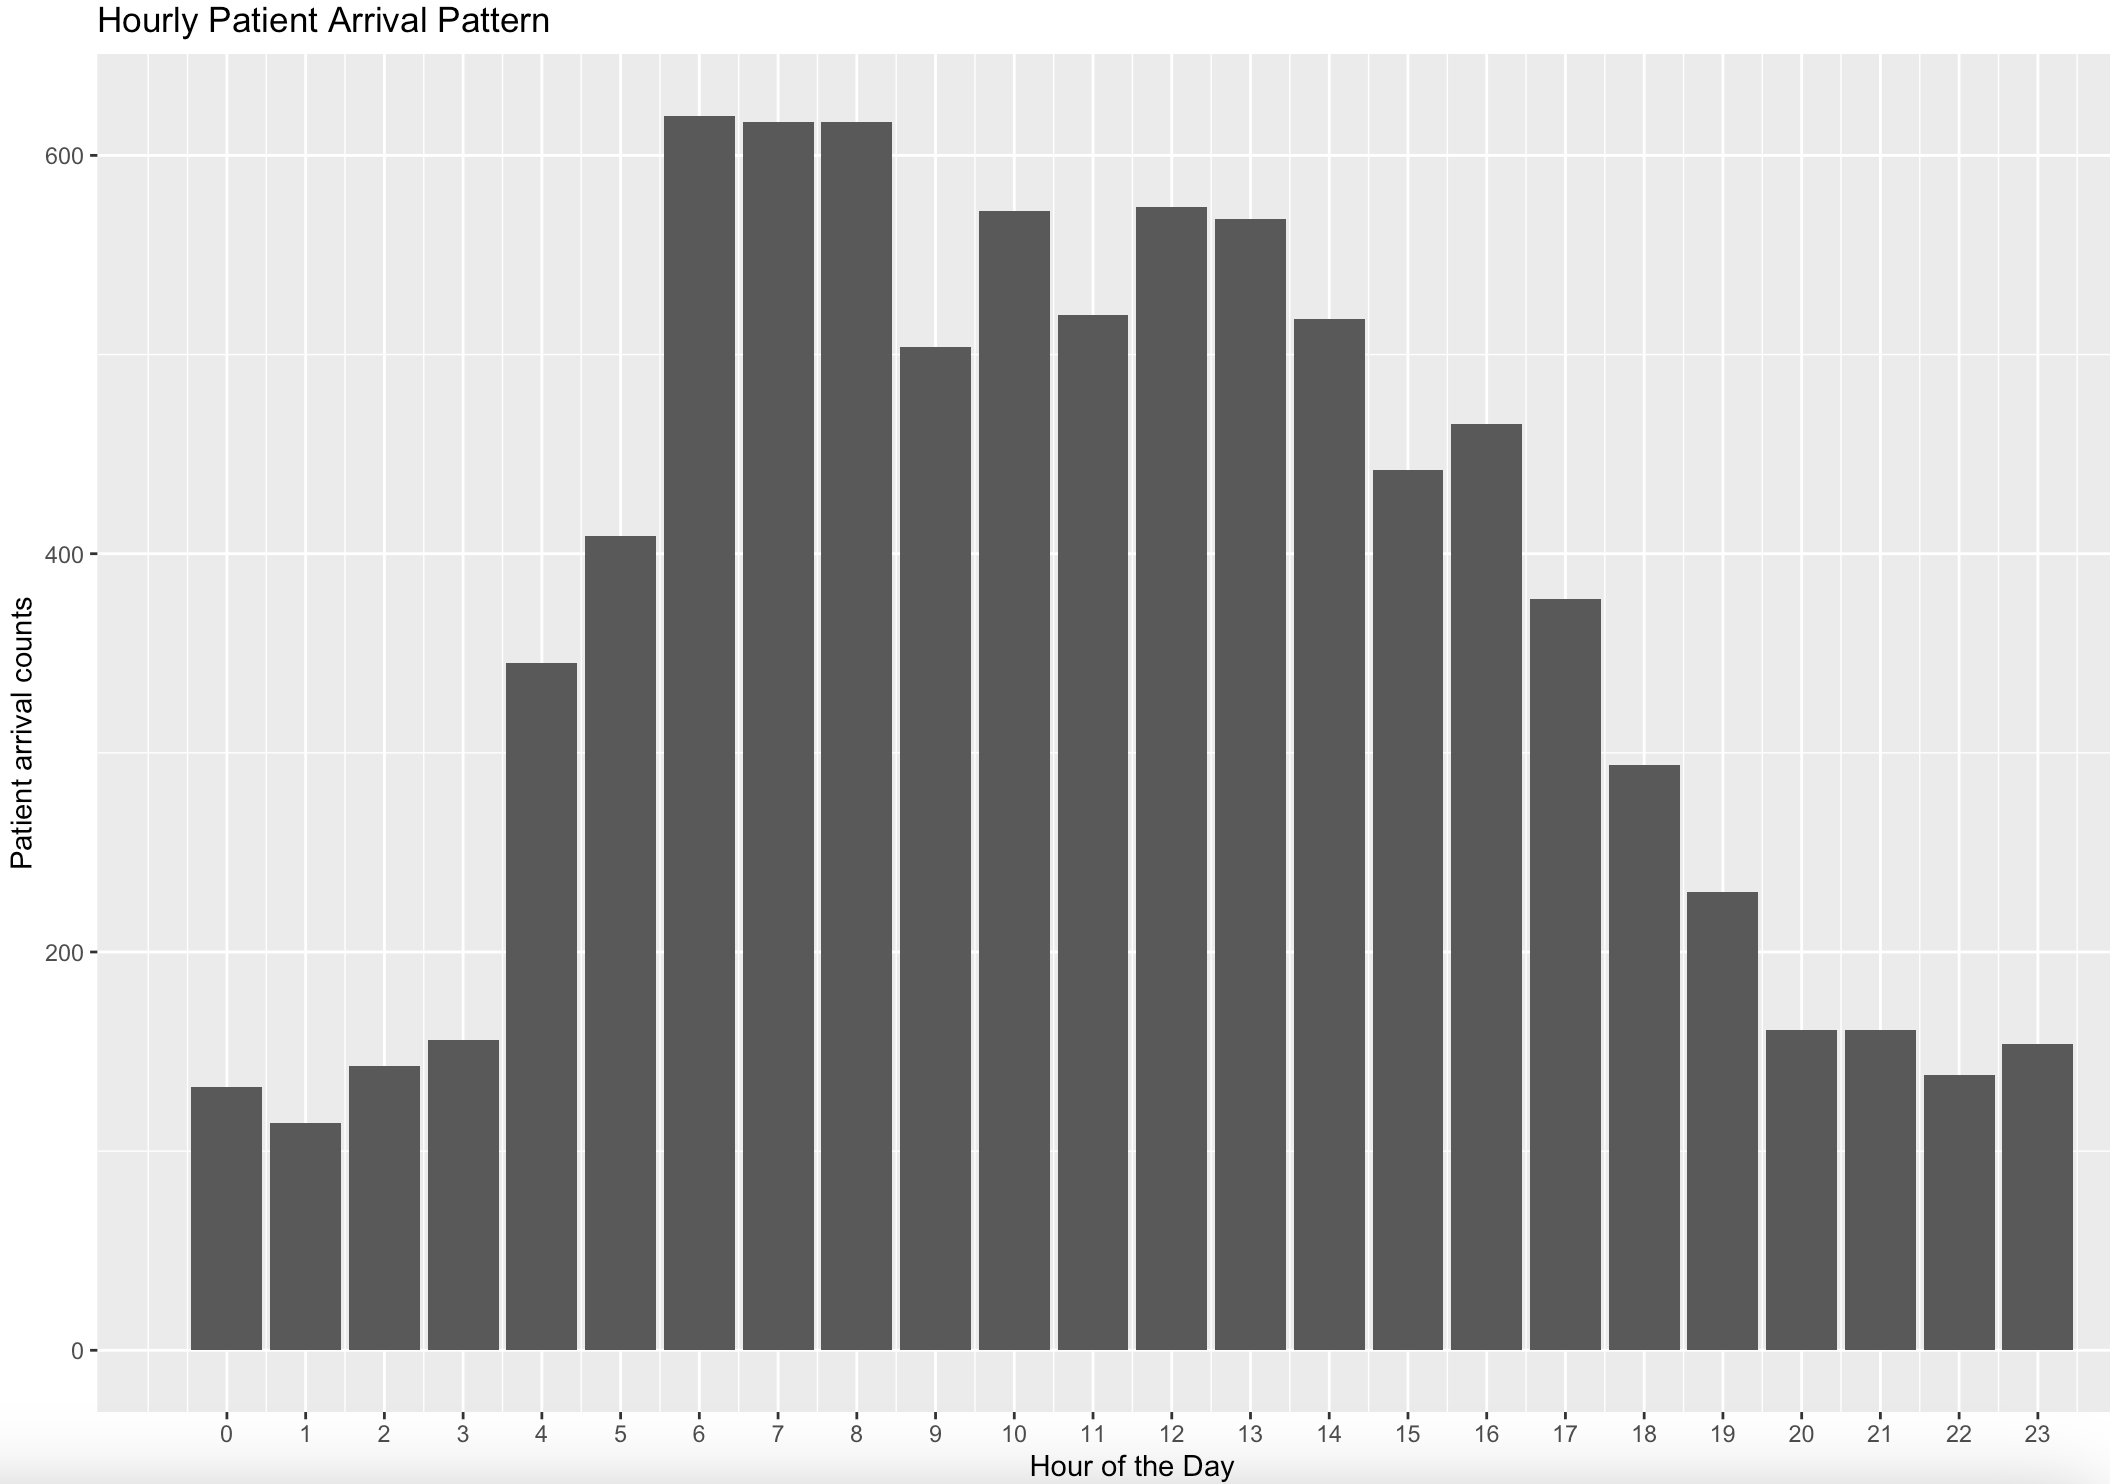
From the figure above, it is evident that the majority of patients typically arrive at UCSD Health Center between 4 am and 5 pm. This observation suggests that physicians working shifts during these hours may have a larger number of patients to attend to, potentially increasing the likelihood of working overtime. To further analyze this, we introduced a binary column named 'busy_hours,' which is assigned a value of 1 if the patient's arrival time falls within the 4 am to 4 pm range. This distinction helps in differentiating between busy and non-busy hours.
Binary Logistic Regression Modeling
We are interested in assessing the statistical association between physician overtime and actual length of stay (LOS), as well as quantifying this relationship. For our analysis, we selected binary logistic regression due to the binary nature of the physician overtime response. We established a baseline model incorporating only actual LOS and busy hours as regressors, and a full model that includes four regressors: actual LOS, busy hours, patient age, and physician age. Given that the correlation between LOS and busy hours is low enough (only 0.0051), the baseline model is unlikely to experience multicollinearity among its regressors. The following details the modeling process for the full model:
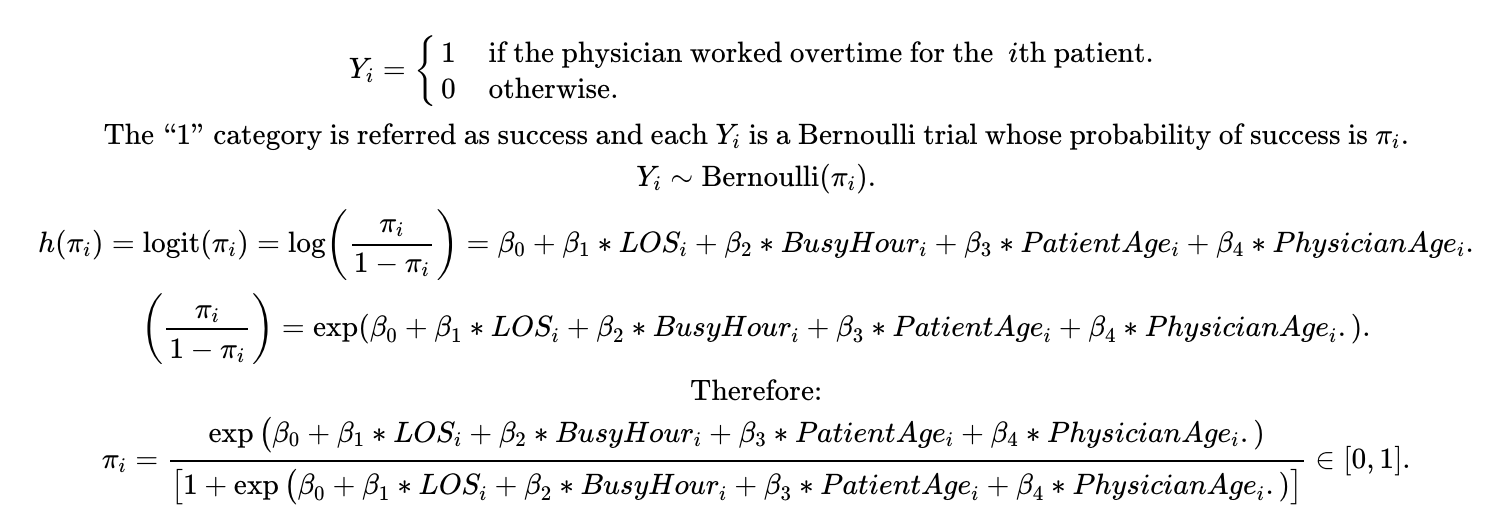
The full model demonstrates a better fit for the data, as indicated by lower AIC and BIC values (3628 and 3671, respectively), compared to the baseline model (AIC 5177, BIC 5283). The results of the full model are detailed below:
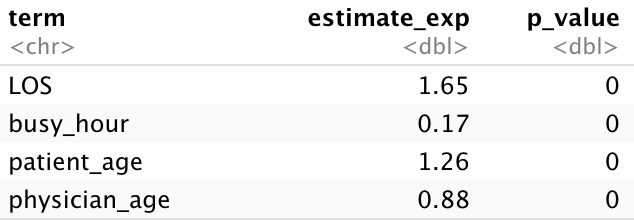
Based on the results obtained at a 0.05 significance level, the four regressors are statistically associated with the logarithmic odds of physician overtime, showing significant outcomes. Specifically, for each unit increase in LOS, a physician is 1.65 times more likely to work overtime rather than finishing their shift on time. Intriguingly, physicians are 5.88 times (inverse of 0.17) more likely to work overtime for patients arriving during non-busy hours compared to those arriving during busy hours. This finding is contrary to our initial hypothesis. A possible explanation could be that during busy hours, UCSD Health Center assigns more physicians to manage the workload, leading to a decreased likelihood of overtime. We plan to investigate these reasons in our future work.
Building upon the detailed insights provided by our modeling results, we have developed a robust framework for predicting the likelihood of overtime work among physicians at UCSD Health. Our analytical model, intricately weaving together variables such as the actual LOS, designated busy hours, as well as the ages of both patients and physicians, offers a comprehensive tool for estimating the propensity of physicians to work past their scheduled shifts. This predictive capability is particularly valuable for hospital administrators and scheduling coordinators, enabling them to proactively identify patterns and potential hotspots for physician overtime. Consequently, this allows for more effective scheduling strategies and workload distribution, ensuring that physicians are less likely to be overburdened by unexpected overtime. Such strategic planning not only contributes to improved operational efficiency within the hospital but also supports the well-being of the medical staff by promoting a more balanced and sustainable work environment. This approach, rooted in data-driven insights, exemplifies how statistical analysis can be leveraged to enhance healthcare management and service delivery.